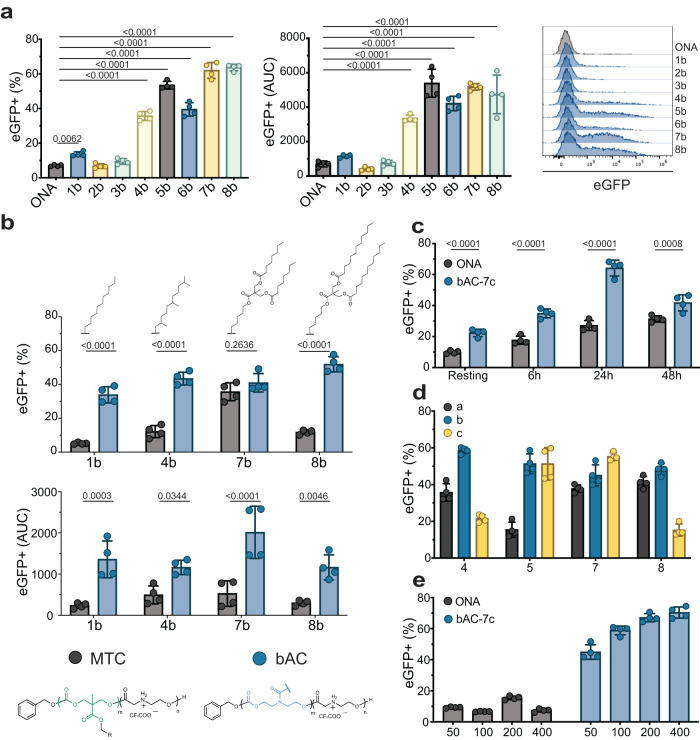
Fig. 3. bAC polymeric backbone improves primary T lymphocyte transfection in vitro.
a bAC CART screening in primary human T cells. Percentage of eGFP+ cells (left) and AUC fluorescent signal (right) 24 h after transfection. (n = 4, bars represent mean values +/− SD). Statistical significance was calculated using one-way ANOVA with Tukey’s multiple comparisons test. b Percentage of eGFP+ cells (top) and AUC fluorescent signal (bottom) 24 h after transfection of CARTs with bAC backbone versus MTC backbone. (n = 4, bars represent mean values +/− SD). Statistical significance was calculated using two-way ANOVA. c Effect of activation time on T-cell transfection with CARTs. (n = 4, bars represent mean values +/− SD). Statistical significance was calculated using two-way ANOVA. d Effect of lipid length screen on T-cell transfection with bAC CARTs (n = 4, bars represent mean values +/− SD). e Effect of mRNA dose (in ng) on CD8 + T cells transfection with CARTs. (n = 4, bars represent mean values +/− SD).

