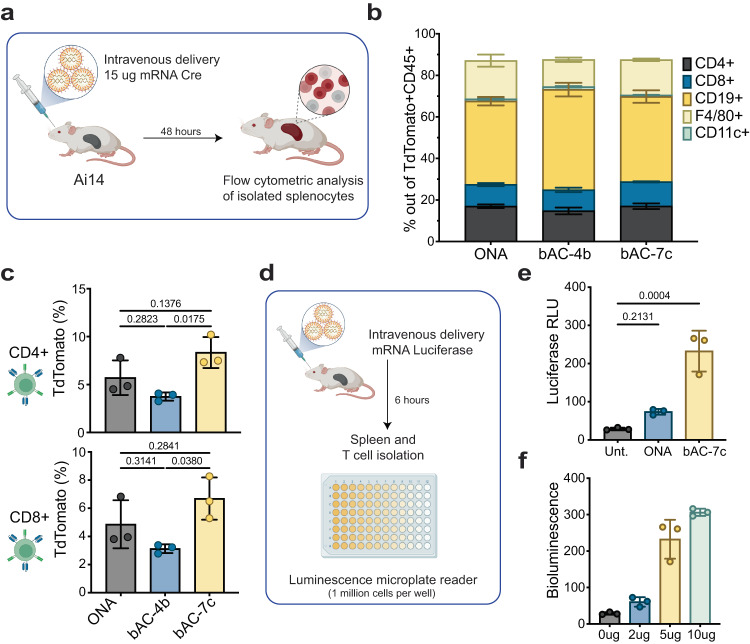
Fig. 7. Cell specificity after i.v. delivery of bAC CARTs.
a Schematic representation of mRNA delivery in vivo to assess cell specificity. Created with BioRender.com. Briefly, 15 µg of Cre mRNA were complexed with each CART and delivered retro-orbitally. Flow cytometric analysis of isolated spleens was performed 48 h after transfection. b Percentage of Cre-mediated recombination in CD45+ subsets in vivo (n = 3, bars represent mean values +/− SD). c Percentage of Cre-mediated recombination in CD4+ and CD8 + T cells in vivo (n = 3, bars represent mean values +/− SD). Statistical significance was calculated using one-way ANOVA with Tukey’s multiple comparisons test. Cell icons were created with BioRender.com. d Schematic representation of mRNA delivery in vivo to assess T-cell-specific luciferase expression. Created with BioRender.com. e Quantitation of luminescence signal in untreated (Unt.) splenic T cells or 6 h after transfection of 5 µg mRNA luciferase with ONA or bAC-7c (n = 3, bars represent mean values +/− SD). Statistical significance was calculated using one-way ANOVA with Dunnett’s multiple comparisons test. f Effect of mRNA dose in isolated splenic T cells 6 h after transfection with bAC-7c (n = 3, bars represent mean values +/− SD).

