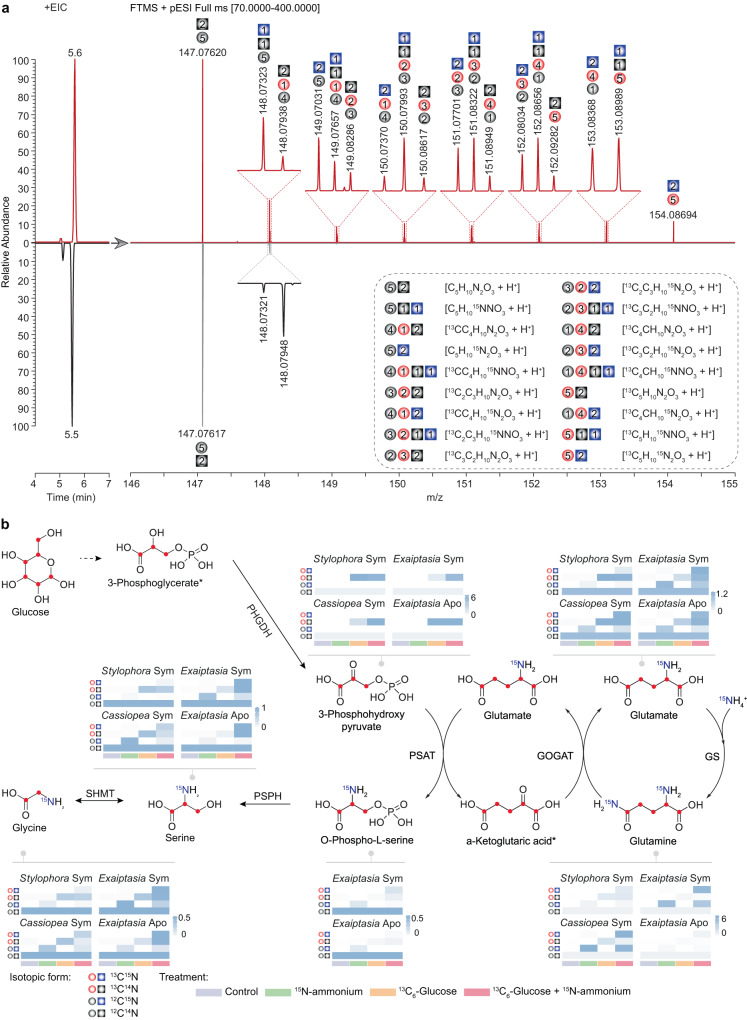
Fig. 4. Identification of isotope-labeled metabolites using UHPLC-HR-MS.
a Extracted ion chromatograms (EIC, Left) and the isotopic distributions (Right) of glutamine from E. diaphana incubated with 13C6-glucose and 15N-ammonium (Top) and the corresponding glutamine standard (Bottom). The inset corresponds to a zoom of the area in which different isotopologue compositions of glutamine (dashed box) were identified using HR-MS. The gray ball and square indicate 12C atom and 14N atom, respectively; the red ball indicates 13C atom, the blue square indicates 15N, and the number of carbon and nitrogen atoms are inserted in the corresponding shapes. b Metabolic footprinting of stable isotopes in the three selected cnidarian species. The proposed 13C and 15N isotope labeling is indicated as red dots or written in blue color in the structural formulas. Heatmap color indicates the relative abundance of isotope-labeled metabolites (specifically summarized as 13C14N, 12C15N, and 13C15N) normalized to their non-labeled counterparts (12C14N). The isotopic forms of each compound shown in the heatmaps follow the same order as in the figure legend. The numeric values for heatmaps are included in Supplementary Data 5. Sym, symbiotic state; Apo, aposymbiotic state; *, undetectable metabolite.

