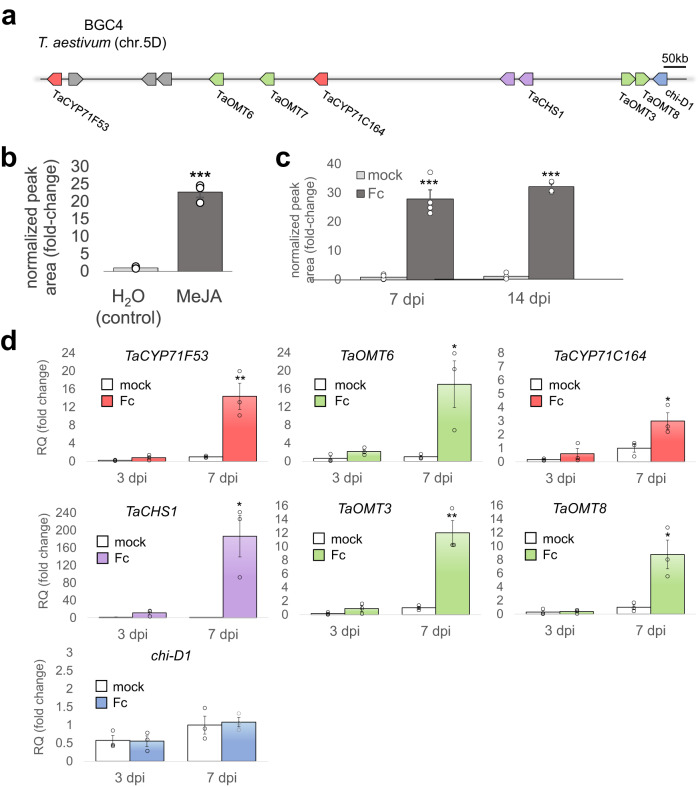
Fig. 1. BGC4(5D) is induced by methyl jasmonate and by fungal pathogen Fusarium culmorum.
a illustration of the gene cluster on wheat chromosome 5D. Red, cytochrome P450s; green, O-methyltransferases; purple, chalcone synthases; blue, chalcone isomerase; gray, other intervening genes. Kb: kilobase. b Relative quantification of (m/z = 329.1012) ion in extracts from wheat blades treated with methyl jasmonate (MeJA) or water (control). p-val = 1.58 × 10⁻⁴. c Relative quantification of (m/z = 329.1012) ion in blade extracts from mock- or F. culmorum- treated wheat plants, 7- and 14-days post infection. Fc, Fusarium culmorum. p-val = 1.47 × 10⁻⁴ (7 dpi), 1.21 × 10⁻⁷ (14 dpi). d Quantitative real-time PCR of seven genes from cluster BGC4(5D) in blade extracts from mock- or F. culmorum- treated wheat plants, 3- and 7-days post infection. Fc, Fusarium culmorum. 7 dpi p-val = 0.0099 (TaCYP71F53), 0.0365 (TaOMT6), 0.0420 (TaCYP71C164), 0.0171 (TaCHS1), 0.0036 (TaOMT3), 0.0221 (TaOMT8), 0.7893 (chi-D1). For panels b, c, and d, relative quantification (fold-change) values indicate means of three biological replicates ± SEM. Asterisks denote the statistical significance of a two-tailed t-test. *P < 0.05, **P < 0.01, ***P < 0.001. Source data are provided as a Source Data file.

