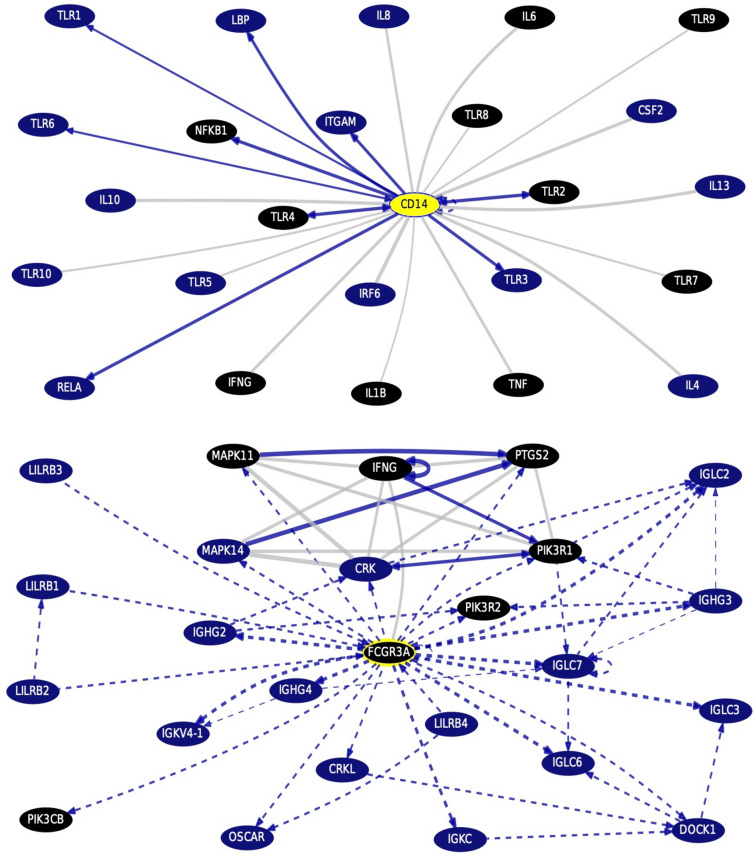
Fig. 4.
Monocytes surface antigens CD14 and CD16A:FCGR3A top interacting genes, with highlighting the drug bank interaction, obtained via gene interactions and pathways from curated databases and text-mining using UCSC Genome Browser Gene Interaction Graph (accessed on November 29th, 2022) http://genome.ucsc.edu/cgi-bin/hgGeneGraph?gene=CD14&1=OK&supportLevel=text&geneCount=25&geneCount=25&geneAnnot=drugbank&1=OK&lastGene=MIR21 and http://genome.ucsc.edu/cgi-bin/hgGeneGraph?supportLevel=text&geneCount=25&geneAnnot=drugbank&1=OK&lastGene=MIR21&gene=FCGR3A, respectively. [Black colored genes, being treatment hits by DrugBank]

