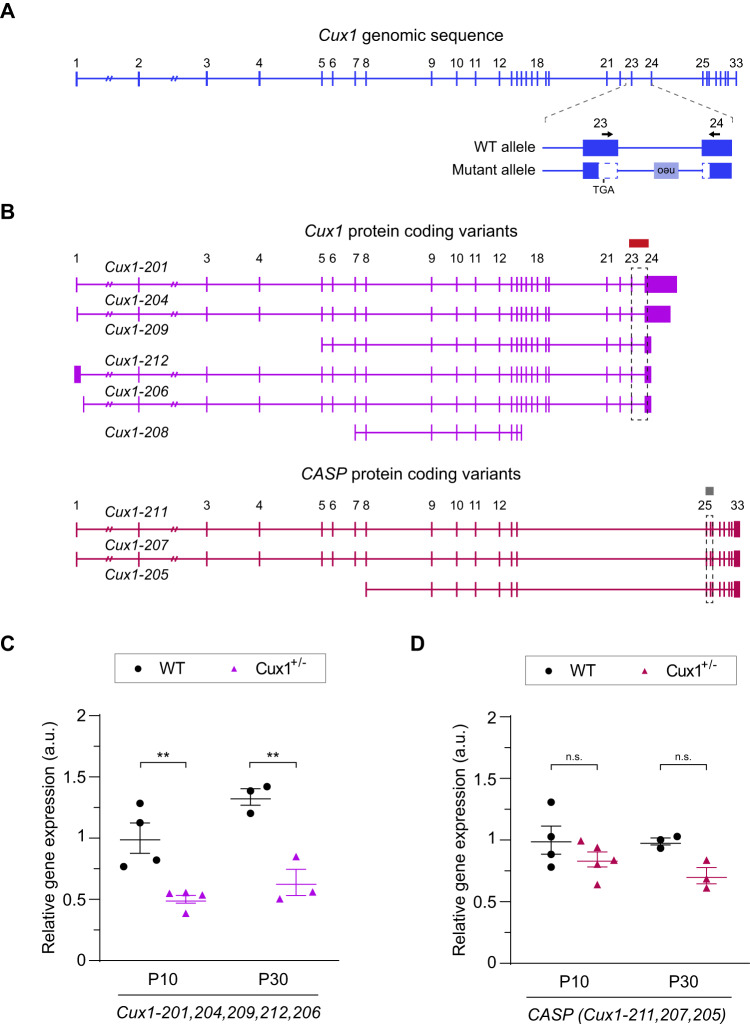
Fig. 2. The levels of WT Cux1 transcripts are reduced in the cortex of Cux1+/− mice.
A Exon structure of Cux1 genomic sequence and detail showing the variant deleting exons 23 and 24 in Cux1+/−. Vertical lines represent individual exons. Arrows highlight primer sequences used for the quantifications of WT transcripts by RT-qPCR. B Predicted transcripts coding for CUX1 and CASP. Boxes and dashed boxes highlight the regions containing the RT-qPCR amplicons used to quantify protein-coding transcripts. The Cux1 amplicon measures all annotated CUX1 protein-coding transcripts (Cux1-201, 204, 209, 212, 206) except Cux1-208. RT-qPCR amplicon for CASP measures all annotated CASP protein-coding transcripts (Cux1-211, 207, 205). C Relative expression of Cux1 protein-coding transcript isoforms (Cux1-201, 204, 209, 212, 206) as shown in (A) and (B) at P10 and P30, quantified by RT-q-PCR. Data are shown normalized to P10 WT levels. Data show mean ± SEM (n ≥ 3 animals per condition. Two-way ANOVA: P-value WT vs. Cux+/- #### ≤0.0001. Post hoc with Tukey´s test: P-value P10 WT vs. Cux1+/− ** ≤0.005, P-value P30 WT vs. Cux+/−** ≤0.005). D Relative gene expression of protein-coding CASP transcripts at P10 and P30. Data are shown normalized to P10 WT levels. Data show mean ± SEM (n ≥ 3 animals per condition. Two-way ANOVA: P-value WT vs. Cux+/- # ≤0.05. Post hoc with Tukey´s test: P-value P10 WT vs. Cux+/− = 0.4641 (n.s.), P-value P30 WT vs. Cux+/− = 0.1846 (n.s.)).

