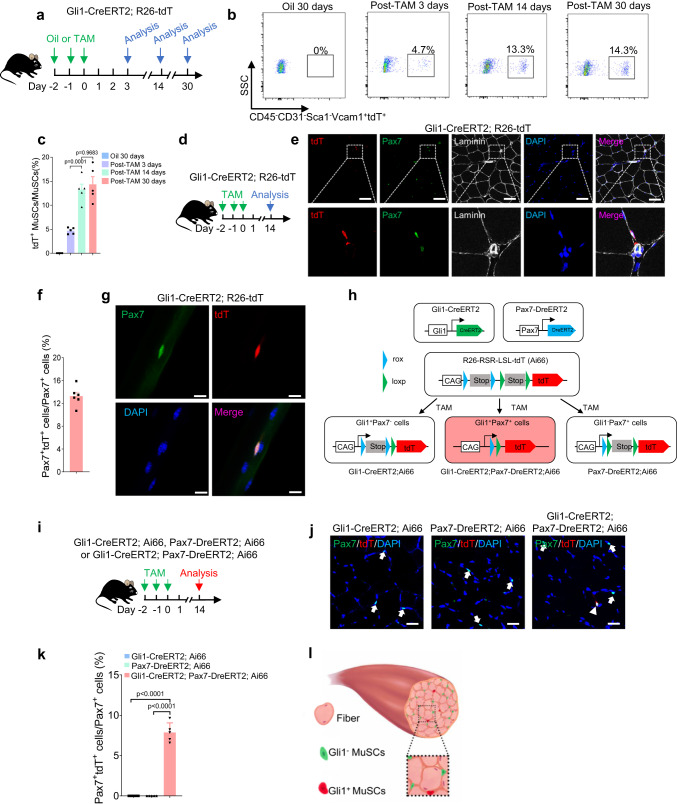
Fig. 2. Identification of a population of MuSCs marked by Gli1.
a Scheme of the experimental strategy. b Representative profiles of fluorescence-activated cell sorter analysis of the percentage of Gli1+ MuSCs from Gli1-CreERT2; R26-tdT mice at different time points with oil or TAM treatment (n = 5). tdT-marked Gli1+ MuSCs were detected within 3 days and plateaued at day 14, showing no further increase at day 30. c Quantification analysis of the percentage of MuSCs expressing tdT at different time points with oil or TAM treatment (n = 5). d Scheme of the experimental strategy for analyzing TAM-induced Gli1+ MuSCs. e Immunofluorescence staining for tdT (red), Pax7 (green), Laminin (gray) and DAPI (blue) in TA muscles (n = 6). Scale bars, 50 µm. Boxed regions are magnified on the low. f Quantification of the percentage of Pax7+ cells expressing tdT (Gli1) (n = 6). g Immunofluorescence staining for tdT (red), Pax7 (green) and DAPI (blue) in isolated single EDL myofibers from hindlimb skeletal muscles (n = 5). Scale bars, 10 µm. h Scheme of the dual-recombinase genetic lineage-tracing strategy. i Schematic of the experimental strategy. j Immunofluorescence staining for tdT (red), Pax7 (green) and DAPI (blue) in TA muscle sections. White arrowhead indicated the tdT+ (Gli1+) Pax7+ cells from different mouse lines (n = 5). White arrows indicated the tdT− (Gli1−) Pax7+ cells. Scale bars, 50 µm. k Quantification of the percentage of Pax7+ cells expressing tdT (Gli1) in different mouse lines (n = 5). l The model specific of MuSC populations. Red indicated the Gli1+ MuSCs. Green indicated Gli1− MuSCs. Light red indicated myofibers. Data are presented as mean ± SEM; Statistical significance was determined by one-way ANOVA (c, k). All numbers (n) are biologically independent experiments. Source data are provided in the Source Data File.

