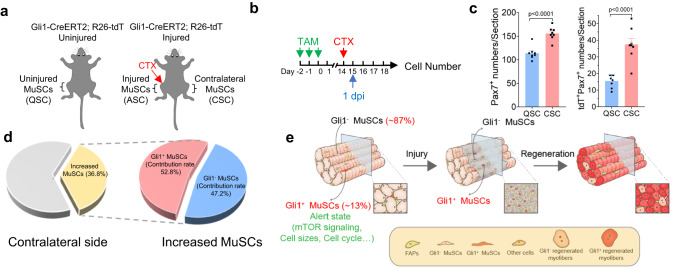
Fig. 8. Gli1+ MuSCs are sensitive to activation cues after injury.
a Scheme of the location of QSCs, CSCs and ASCs in relation to muscle injury. QSCs, quiescent MuSCs. CSCs, contralateral MuSCs. ASCs, activated MuSCs. b Scheme of the experimental strategy. c Statistical analysis of the number of total MuSCs or tdT+ (Gli1+) MuSCs per section in TA muscle of uninjured mice and the contralateral TA muscle of injured mice (n = 8). d Left panel: Quantification of the percentage of CSCs from the contralateral TA muscle of injured Gli1-CreERT2; R26-tdT mice at 1 dpi. The yellow histogram represented the percentage of increased MuSCs from the contralateral TA muscle compared with uninjured mice (n = 8). Right panel: Quantification of the percentage of tdT+ (Gli1+) and tdT− (Gli1−) CSCs in increased MuSCs from the contralateral TA muscle. The blue histogram represented the percentage of increased tdT− (Gli1−) CSCs. The red histogram represented the percentage of increased tdT+ (Gli1+) CSCs. dpi, day post injury. e Schematic overview of the participation of Gli1+ MuSCs in muscle regeneration. Gli1 marks a distinct population of MuSCs, which serves as sentinel cells to enable rapid response after injury and speed muscle regeneration. Data are presented as mean ± SEM; Statistical significance was determined by two-tailed unpaired Student’s t test (c). All numbers (n) are biologically independent experiments. Source data are provided in the Source Data File.

