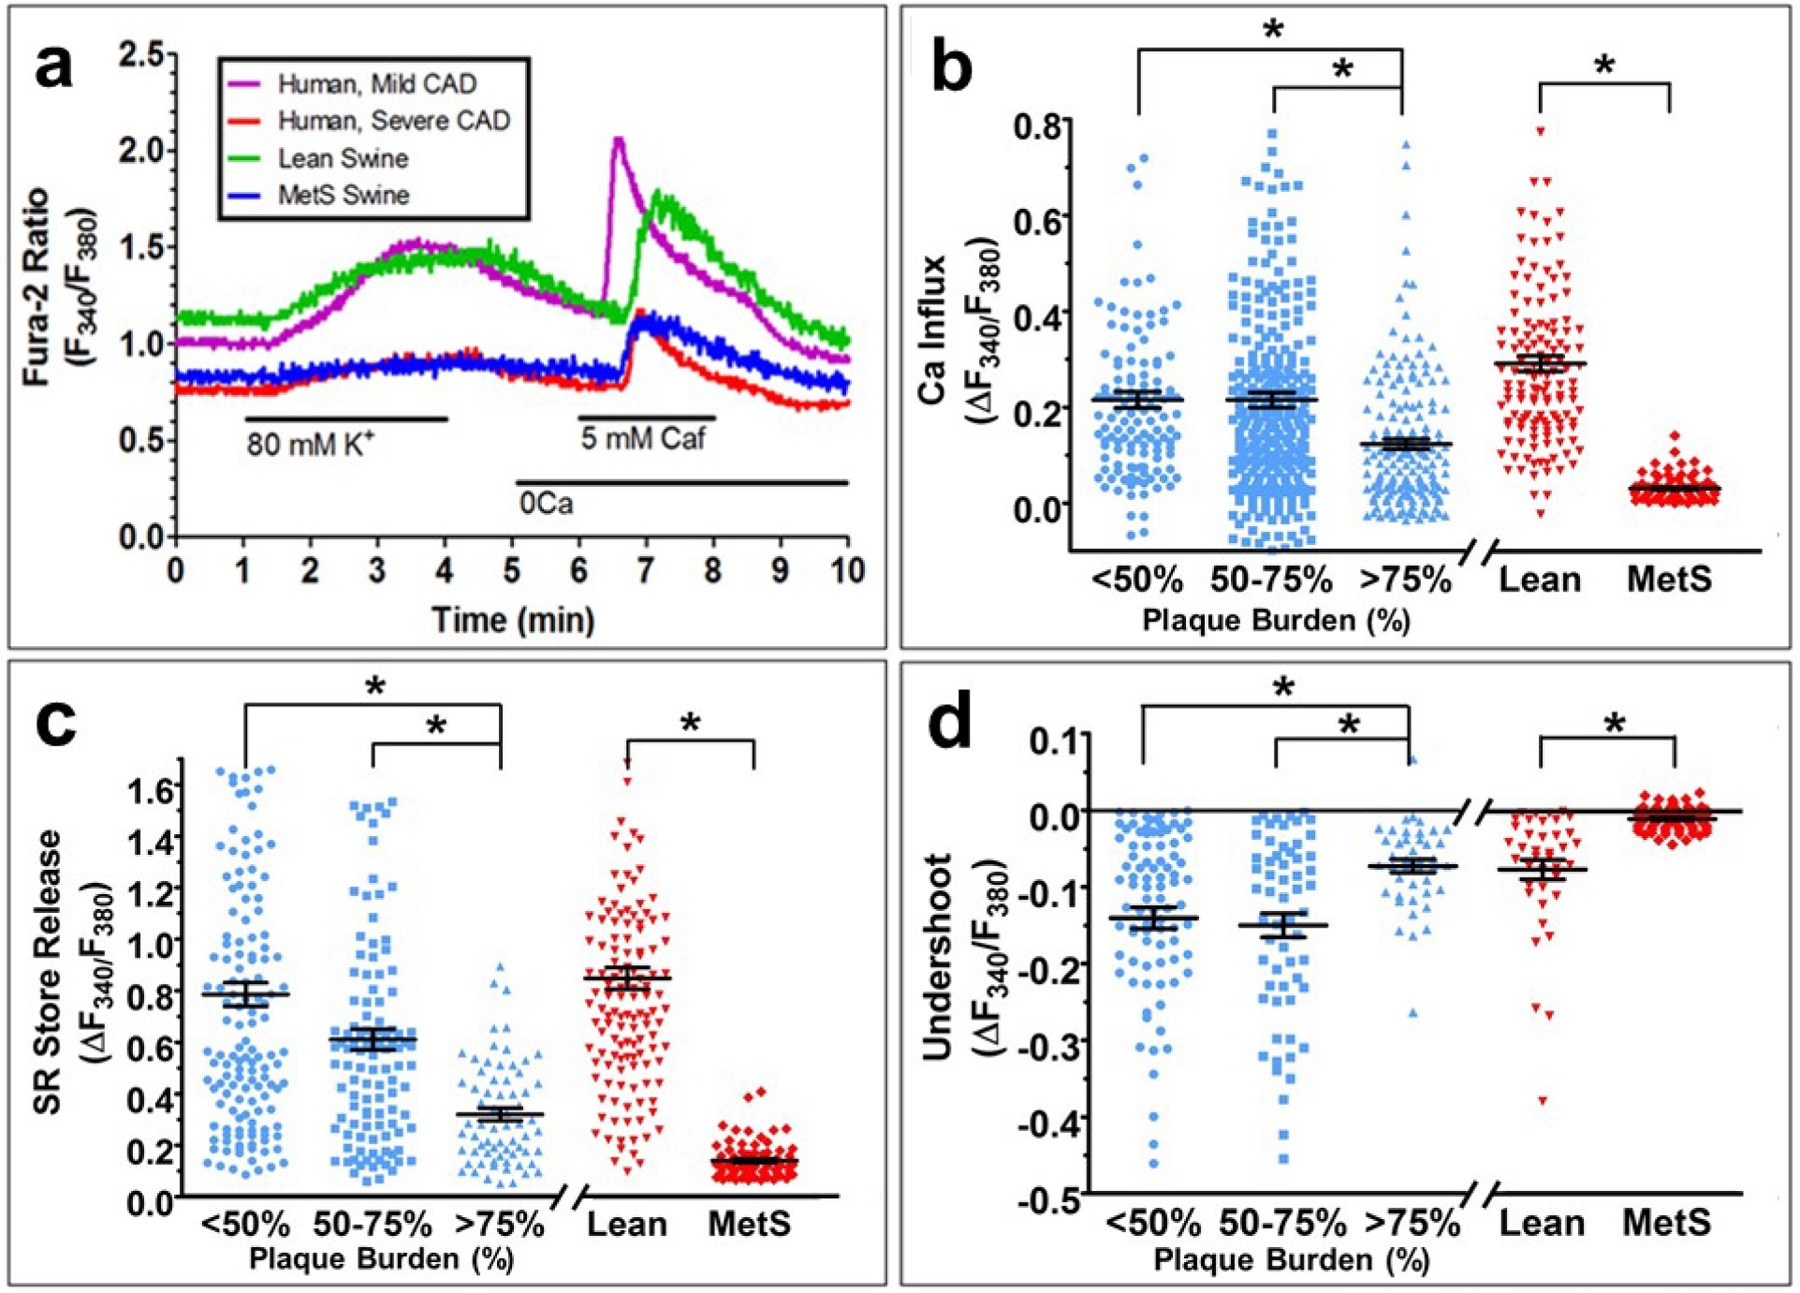
Fig. 5. Intracellular Ca2+ measures in CSM cells.

Typical Ca2+ tracings show the change in the F340/F380 excitation fluorescence emission ratio from human and swine CSM cells. There are similarities between humans with mild, non-ischemic CAD and lean swine and between humans with severe, ischemic CAD and MetS swine (a). Mild, non-ischemic CAD was defined by a plaque burden below 50%, while severe, ischemic CAD was defined by a plaque burden of over 75%. Both humans and swine with CAD exhibit decreased Ca2+ influx (b), SR Ca2+ store capacity (c), and SERCA function (d). Group data are plotted as mean ± SE with black lines and bars; individual cells are show in blue symbols for humans and red symbols for swine.
