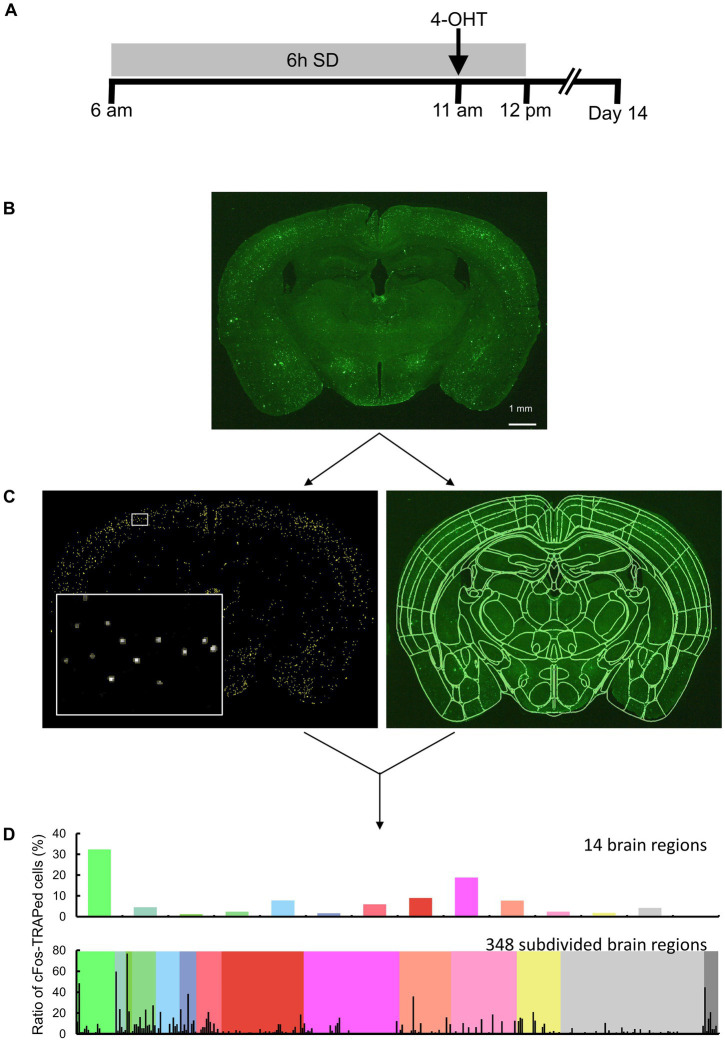
Figure 1.
Overview of the study approach. (A) Schematic drawing of sleep deprivation (SD) and 4-OHT injection timelines. (B) Brain sections of TRAP2;Rosa26-ZsGreen mice, with or without SD, were measured by fluorescence imaging. Scale bar indicates 1 mm. (C, left) Following image preprocessing, cFos-TRAPed cells were labeled by thresholding, and their x and y coordinates were obtained using Image J. Each yellow ROI outlines a valid cFos-TRAPed cell, and the magnified view of the area enclosed by the white box is shown on the bottom left. (C, right) 3D segmentation of brain sections was performed by semi-automated registration (SHARCQ, Lauridsen et al., 2022) to the Allen brain atlas (Wang et al., 2020) using MATLAB. (D) The ratios of cFos-TRAPed cells in 14 brain regions were quantified and compared. For a total of 348 subdivided regions, the ratios of cFos-TRAPed cells in each of the 14 regions were obtained.

