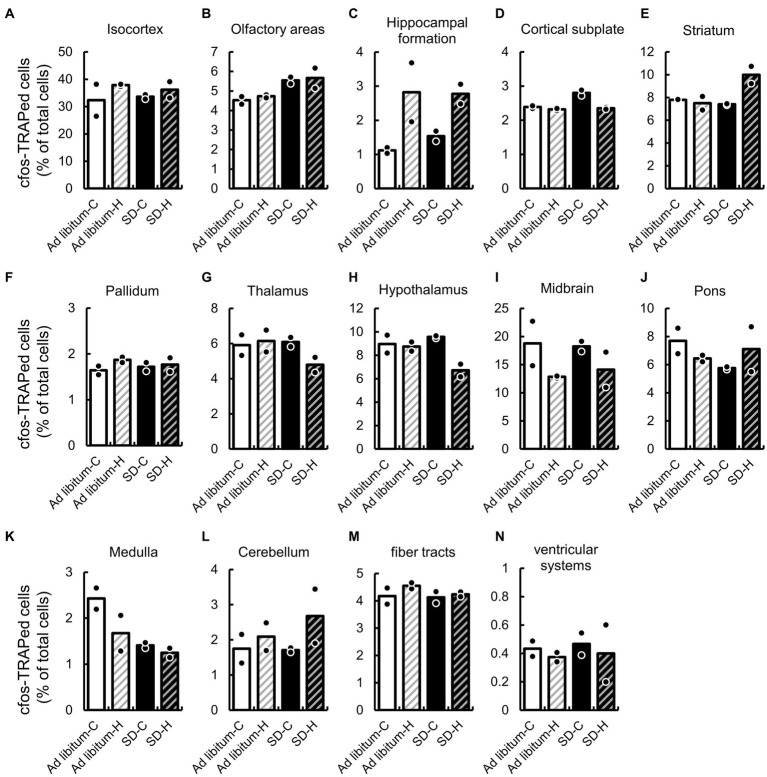
Figure 3.
SD-induced changes of cFos-TRAPed cells ratio in 14 brain regions. The cFos-TRAPed cell ratios in 14 brain regions, (A) isocortex; (B) olfactory areas; (C), hippocampal formation; (D) cortical subplate; (E) striatum; (F) pallidum; (G) thalamus; (H) hypothalamus; (I) midbrain; (J) pons; (K) medulla; (L) cerebellum; (M) fiber tracts; and (N) ventricular systems are shown. For each group, the plots and bars correspond to the value for each animal and the mean of the animals (N = 2, respectively). The values and two-way ANOVA results are shown in Supplementary Table S2.

