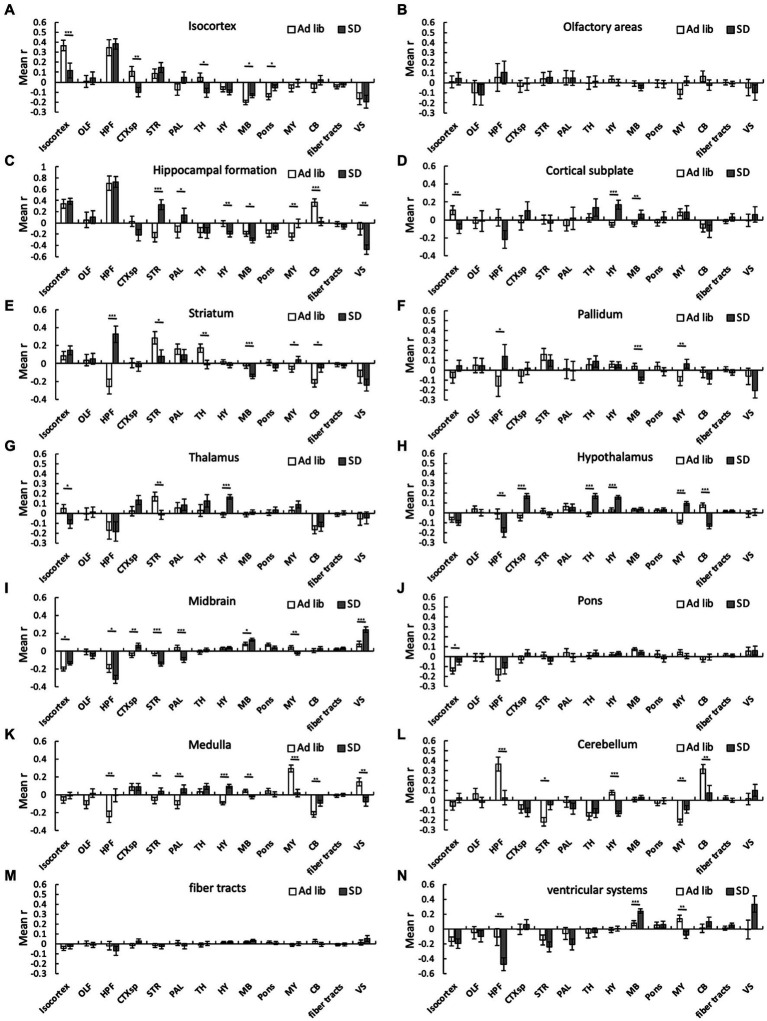
Figure 4.
Connectivity changes among brain regions due to SD. Connectivity among 294 regions was estimated for ad libitum sleep animals and SD animals regardless of the method, and mean interregional correlation coefficients (mean r) were obtained for the 14 brain regions. The bar graph shows the mean r between one region and another within that region: (A), isocortex; (B), olfactory areas; (C), hippocampal formation; (D), cortical subplate; (E), striatum; (F), pallidum; (G), thalamus; (H), hypothalamus; (I), midbrain; (J), pons; (K), medulla; (L), cerebellum; (M), fiber tracts; and (N) ventricular systems. Error bars indicate SEM. *p < 0.05; **p < 0.01; and ***p < 0.001 for the difference between ad libitum sleep mice and SD mice by Kolmogorov–Smirnov test.

