Figure 1.
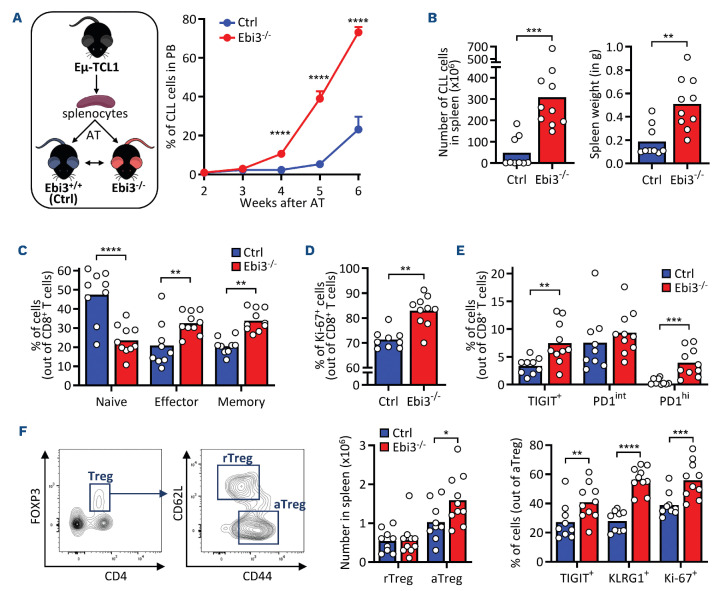
EBI3 depletion promotes leukemia development and induces an enhanced immunosuppressive tumor microenvironment. (A) Two cohorts of recipient Ebi3-/- and control (Ctrl) mice were injected with splenocytes isolated from leukemic Eμ-TCL1 mice. Two weeks after adoptive transfer (AT), mice were bled weekly to monitor chronic lymphocytic leukemia (CLL) development in peripheral blood (PB). Percentages of neoplastic CD5+ CD19+ cells were detected in PB by flow cytometry (FC); (N=18 for control [Ctrl] and N=19 for Ebi3-/-, two-way ANOVA). (B-F). For the second cohort, splenic tumor microenvironment (TME) was characterized by FC (N=9 for Ctrl and N=10 for Ebi3-/-). (B) Number of CD5+ CD19+ CLL cells in the spleen (left), and spleen weight (right) in Ebi3-/- compared to Ctrl mice. (C) Frequency of naive (CD62L+ CD44-), effector (CD62L- CD44+) or memory (CD62L+ CD44+) CD8+ T cells. (D) Percentage of proliferative Ki-67+ cells among CD8+ T cells in the spleen of Ctrl and Ebi3-/- mice. (E) Frequency of the indicated populations in Ctrl and Ebi3-/- CD8+ T cells. (F) Representative flow cytometry plot (left) depicting the gating strategy used to discriminate activated regulatory T cells (aTregs, CD62Lhi CD44lo) from resting regulatory T cells (rTregs, CD62Llo CD44hi). Number of rTregs and aTregs in spleens (middle). Frequency of the indicated populations in Ctrl and Ebi3-/- Tregs (right). Unpaired t test, *P<0.05, **P<0.01, ***P<0.001, ****P<0.0001.

