Figure 3.

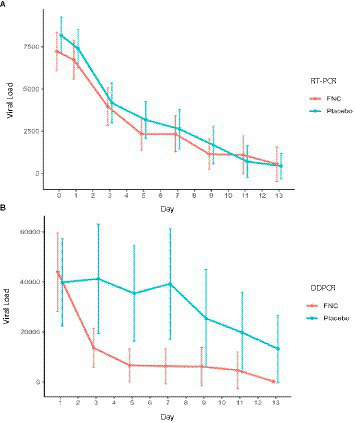
(A) Estimated (RT-PCR) and (B) absolute viral load analysis (ddPCR) of participants in the FNC group and the placebo group during the treatment days. Data are median (SD). (Red line, FNC; blue line, placebo).

(A) Estimated (RT-PCR) and (B) absolute viral load analysis (ddPCR) of participants in the FNC group and the placebo group during the treatment days. Data are median (SD). (Red line, FNC; blue line, placebo).