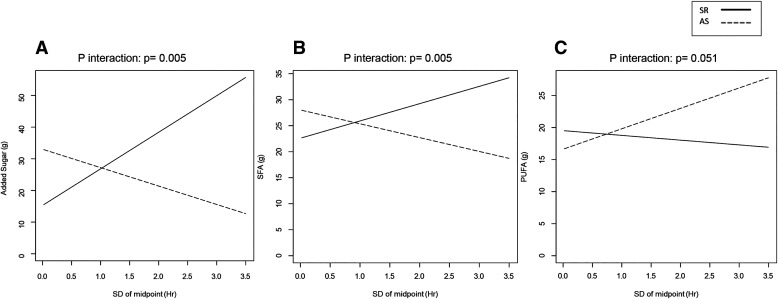
Figure 2. Sleep condition influenced the relationship between variability in eating midpoint and intake of added sugars (β = 17.3 ± 6.2; P interaction < .01), SFA (P interaction < .01), and PUFA (P interaction = .05 [trend]).
This figure illustrates the relationship between the standard deviation of eating midpoint and intakes of added sugar (A), SFA (B), and PUFA (C) under conditions of SR and AS. The regression lines between exposure and outcome under SR and AS are depicted using solid and dashed lines, respectively. AR = adequate sleep, PUFA = polyunsaturated fat, SFA = saturated fat, SR = sleep restriction.

