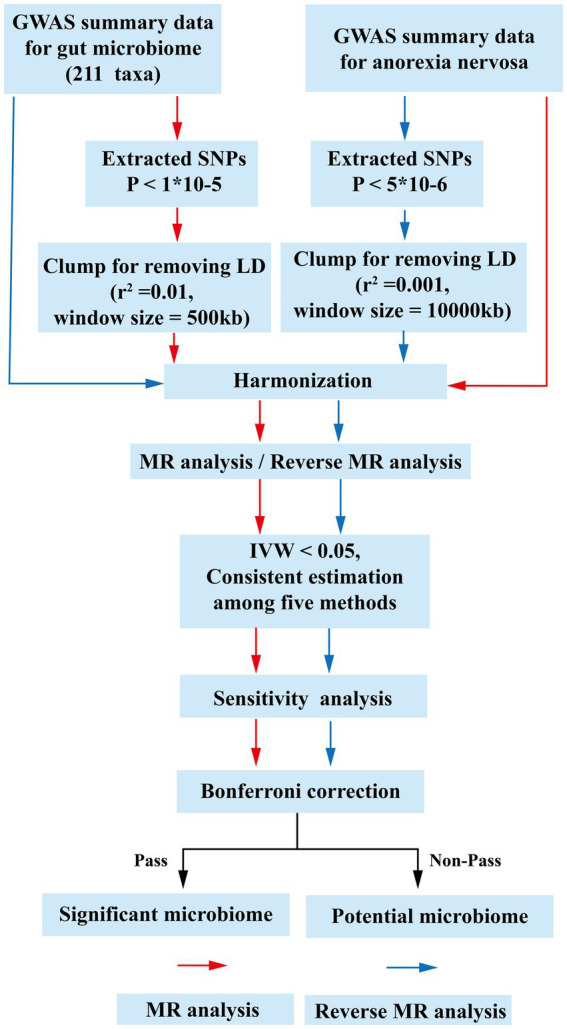
Figure 1.

The flow chart of the study. The GWAS data of flora was used as exposure, and anorexia nervosa was used as outcomes for MR analysis. The instrumental variables of flora were extracted in the following way: (1) p < 1 × 10⁻⁵; (2) r2 = 0.01, kb = 500. Five methods were used for MR analysis after harmonization. Floras with IVW estimates below 0.05, exhibiting consistent results across the five analytical methods, were deemed to hold potential association. Subsequently, an investigation into the presence of pleiotropy and heterogeneity among these potential floras was undertaken. Those floras displaying pleiotropic or heterogeneous characteristics were promptly eliminated. Meaningful bacterial groups were screened out. Then reverse MR analysis was performed, and different criteria were used for the screening of instrumental variables for AN (p < 5 × 10⁻⁶, r2 = 0.001, kb = 10,000). All potential floras were corrected by the Bonferronitest. The floras passed the Bonferroni were considered as significant. MR, Mendelian randomization; LD, linkage disequilibrium; GWAS, Genome Wide Association Study; SNPs, single nucleotide polymorphisms; IVW, inverse variance weighting.
