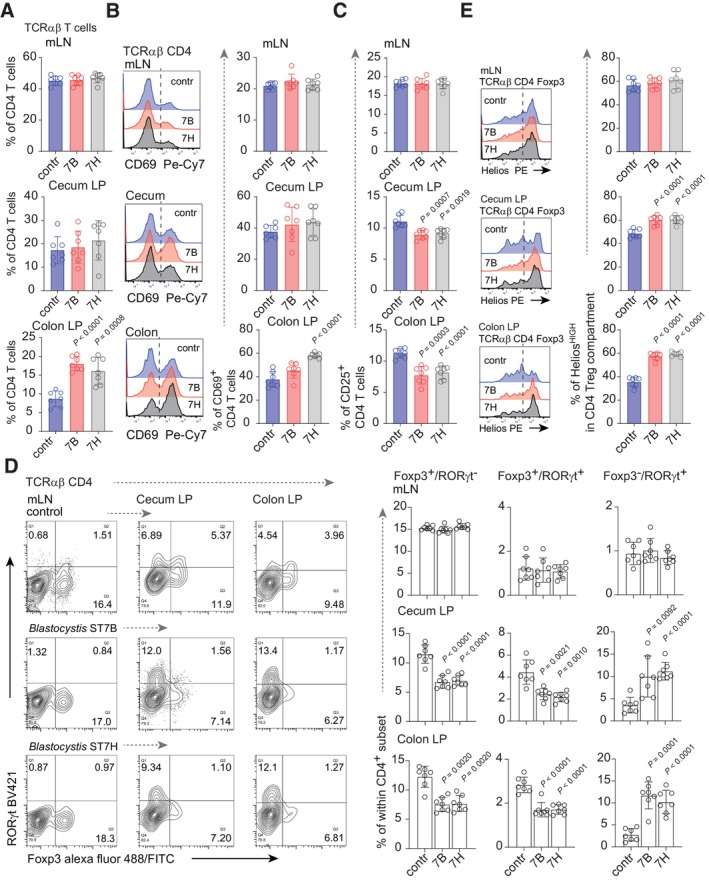
Figure 1. TCRαβ compartment in Blastocystis ST7‐infected mice.

- Percentage of TCRαβ CD4+ T cells in mesenteric lymph nodes (mLN), cecum lamina propria (LP), and colon LP from control and Blastocystis ST7B‐ and ST7H‐infected groups.
- CD69 expression on CD4+ T cells from infected and non‐infected group. Left: representative histograms. The origin of T cells is indicated on the top of each histogram. Right: bar charts representing statistical analysis.
- Bar charts depicting expression of CD25 on LP and mLN CD4+ lymphocytes from control and infected cohorts.
- Left: Representative dot blots of Foxp3+ and RORγt+ distribution within CD4+ T cell compartments. Columns refer to site of CD4+ isolation while rows to the infection status. Right: bar charts representing statistical analysis. Columns refer to a particular phenotype, rows to the T cell origin.
- Helios expression in Foxp3+ Tregs from non‐infected and Blastocystis‐infected counterparts. Left: representative histograms. Right: bar charts representing percentage of HeliosHi cells within Treg subsets.
Data information: All experimental groups comprised seven animals in two separate experiments. Bar plots show mean statistic value and error bars indicate s.d., Box‐and‐whisker plot show first and third quartile with median value indicated, error bars indicate s.d. Statistical analysis was performed using a two‐tailed t‐test with Welch correction. When P < 0.05 (experimental to control groups), the values are indicated.
Source data are available online for this figure.
