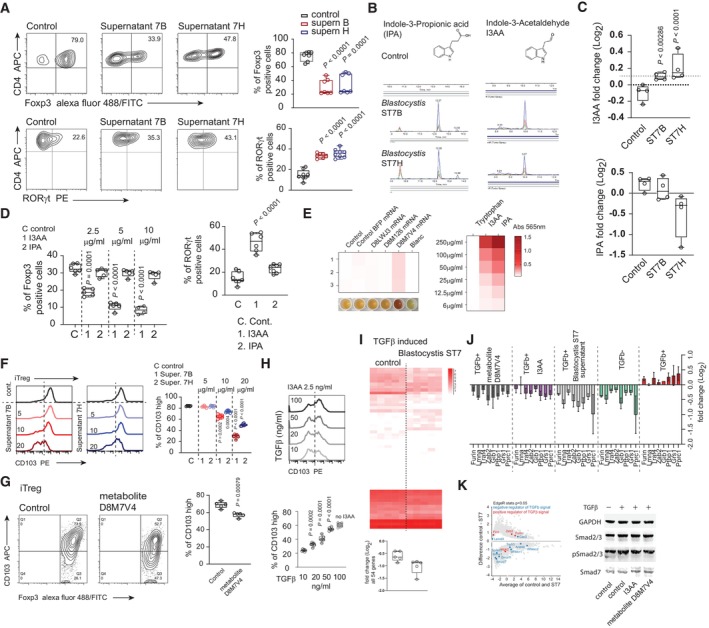
Figure 2. Blastocystis‐derived tryptophan metabolites negatively affect iTreg generation and enhance Th17 polarization in vitro .

- In vitro conversion of CD4+ T cells toward iTreg (upper panel) and RORγt+ Th17 subset (lower panel) and with the presence of Blastocystis‐derived metabolites and in the control condition. Supernatants for ST7B and ST7H were derived from normalized cultures characterized by similar number of protists.
- Characterization of the Blastocystis‐derived metabolites. Using LC–MS, two indole derivatives indole‐3‐acetaldehyde (I3AA), and indole 3‐propionic acid (IPA) were identified.
- The quantitative analysis of I3AA (upper chart) and IPA (lower bar chart) metabolites in the gut content of the control and Blastocystis ST7B and ST7H‐infected animals.
- Right, Th17 in vitro conversion of naïve CD4+ T cells in the presence of I3AA and IPA. Experiments were carried out in 5 μg/ml of IPA and I3AA. Left. In vitro conversion of CD4+ T cells toward iTreg in conditions representing different concentrations of I3AA and IPA.
- Heat map representing extent of tryptophan breakdown carried out by the HEK‐293 cells transfected with different mRNAs. Heat map represents the intensity of the colored compound produced from the supernatant (left) or the compound standard (right), which is proportional to the indole derivative in the sample. Efficiency of tryptophan‐derived metabolite synthesis in culture medium was estimated colorimetrically using modified Kovac's reagent, measuring absorbance at 565 nm.
- Expression of CD103 on the surface of iTreg converted in the presence of different concentration of indole derivatives isolated from Blastocystis ST7B and ST7H culture supernatants.
- CD103 expression on the surface of iTreg converted in the presence of tryptophan metabolite produced by the D8M7V4‐transfected HEK‐293 cells.
- Expression of CD103 on the surface of iTreg converted in the presence of different concentrations of TGFβ exposed to constant concentrations of I3AA.
- The pool of 54 genes differentially expressed in the gut of Blastocystis ST7‐infected animal. TGFβ‐upregulated genes identified in the in vitro stimulation experiment were selected. Box chart below heat map represents changes in expression of the 54 TGFβ‐inducible genes in the control and Blastocystis ST7‐infected groups.
- Expression analysis (using qPCR) of the eight TGFβ‐inducible genes downregulated in the gut tissue of Blastocystis ST7‐infected animals. Analysis was carried out on cDNA synthesized from in vitro TCR stimulation of the CD4+ T cells in the presence or absence of TGFβ.
- Left, MA plot of gut tissue transcriptomes from control and Blastocystis ST7 infected animals. Expression of negative and positive TGFβ regulators are highlighted in blue and red, respectively. Right, representative Western blots of Smad2 and Smad3 phosphorylation status and total Smad7 expression in CD4+ T cells after exposure to TGFβ and I3AA or D8M7V4‐transfected HEK‐293 cell‐derived tryptophan metabolites.
Data information: Bar plots show mean statistic value and error bars indicate s.d., Box‐and‐whisker plot shows first and third quartile with median value indicated, and error bars indicate s.d. Experimental and control groups comprised n = 6 each, except n = 4 in E (two repeats of the experiment with duplicated samples per each condition). Statistical analysis performed using two‐tailed t‐test with Welch correction. P‐values are indicated when P < 0.05 (experimental to control groups).
Source data are available online for this figure.
