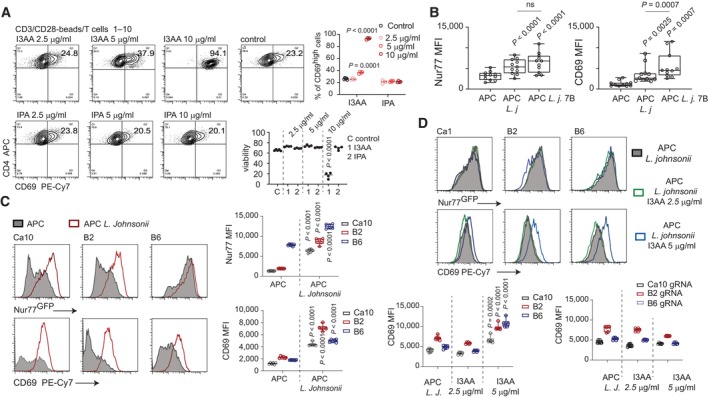
Figure 3. I3AA changes TCR signal interpretation.

-
ACD69 expression on T cells stimulated with anti‐CD3/CD28 beads incubated with different concentrations of I3AA (upper) and IPA (lower).
-
B–DNur77GFP and CD69 expression on L. johnsonii‐specific hybridoma clones after treatment as follows: (B) Overnight incubation with APC (left), APC pulsed with bacterial lysate (middle‐APC L.j), and APC pulsed with bacterial lysate plus Blastocystis metabolites (APC L.j. 7B). Each dot represents an individual hybridoma clone. Statistical analysis was performed using two‐tailed paired t‐test. (C) Overnight incubation with APC alone or APC pulsed with bacterial lysate. S.d. calculated from four individual experiments. (D) Upper panel and left plot: Exposure to constant concentration of cognate antigen and different concentrations of I3AA. Right plot: Exposure to constant concentration of cognate antigen and different concentrations of I3AA.
Data information: Box‐and‐whisker plot show first and third quartile with median value indicated, and error bars indicate s.d. Statistical analysis was performed using a two‐tailed t‐test with Welch correction. P‐values are indicated when P < 0.05 (experimental to control groups). Experimental and control groups comprised of: n = 4 each (A), n = 11 (B), n = 6 (C, D).
Source data are available online for this figure.
