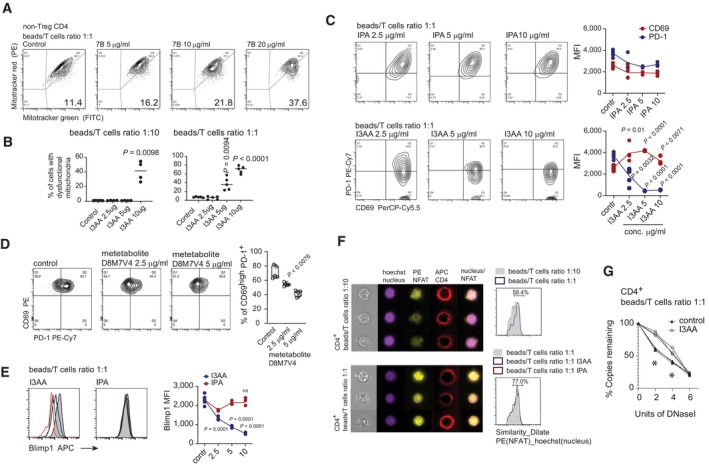
Figure 4. I3AA induces hyperactivation of CD4+ T lymphocytes and prevents them from exhaustion.

- Proportion of T cells with non‐respiring mitochondria stimulated in the presence of different concentrations of indole derivatives isolated from the cultures of Blastocystis ST7B. Total indole in the given experimental condition was estimated using Sigma indole detection kit (μg/ml).
- Proportion of T cells with non‐respiring mitochondria measured in two TCR stimulation conditions, low (left) and high (right) TCR stimuli, upon incubation of T cells with different concentrations of I3AA.
- Expression of CD69 and PD‐1 by T cells experiencing different TCR stimulation conditions, incubated with different concentrations of I3AA.
- Expression of CD69 and PD‐1 by the TCR‐stimulated T cells in presence of different concentrations of tryptophan metabolite produced by D8M7V4‐transfected HEK‐293 cells.
- Expression of Blimp‐1 in cells activated with anti‐CD3/CD28 beads exposed to different doses of I3AA or IPA.
- Nuclear localization of NFATc1 (stained with PE‐conjugated antibody) visualized using IFC. Low (upper left) and high (lower left) TCR saturation were compared.
- Quantitative analysis of DNase I hypersensitivity of NFATc1‐dependent PD‐1 promoter regions. DNase I sensitivity was analyzed on nuclei from T cells treated with 5 μg of I3AA or untreated. Three experimental replicates for each condition. Non‐parametric Mann–Whitney test was utilized, * indicates statistical significance when P < 0.05.
Data information: All experimental groups comprised minimum four replicates. Box‐and‐whisker plot show first and third quartile with median value indicated, and error bars indicate s.d. Statistical analysis was performed using a two‐tailed t‐test with Welch correction. The P‐values are indicated when P < 0.05 (experimental to control groups). Experimental and control groups comprise n = 3 (F) n = 4 (B, left) n = 5 (B, right; C–E).
Source data are available online for this figure.
