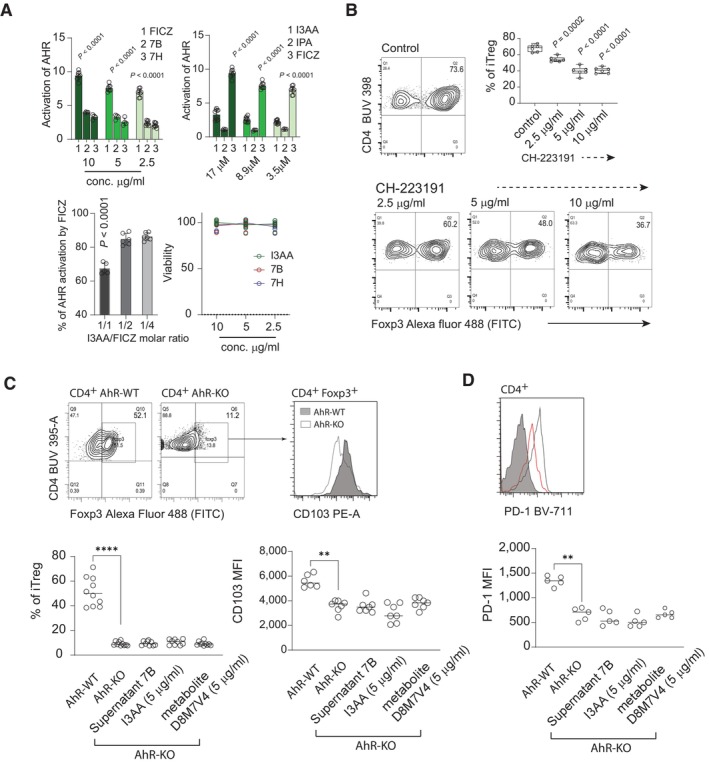
Figure 5. I3AA mimics biological activity of a synthetic AhR inhibitor.

- AhR activation by FICZ and Blastocystis‐derived metabolites. Top left: AhR nuclear translocation was measured using HT29 Lucia AhR reporter cell line. Top right: AhR activation by FICZ, IPA and I3AA. Bottom left: Inhibition of the AhR‐FICZ interaction by I3AA. Bottom right: viability of HT29 cells after exposure to different concentrations of Blastocystis‐derived metabolites. All replicates (n = 8 FICZ, supernatants 7B and 7H, n = 4 IPA n = 10 I3AA, FICZ inhibition 1/1 n = 5, 1/2 n = 6, 1/4 n = 6), and statistics. P‐values are indicated from non‐parametric Mann–Whitney test.
- Efficacy of Treg polarization in the presence of the AhR antagonist CH‐223191. All replicates (n = 6) and statistics. P‐values for two‐tailed t‐test with Welch correction are indicated.
- Left: In vitro conversion of CD4+ T cells isolated from AhR‐WT and AhR‐KO mice toward iTreg. Right: CD103 expression on polarized iTreg generated from AhR‐WT and AhR‐KO CD4+ T cells. Upper plots show examples of flow cytometry data, and lower plots show all replicates (n = 10 Foxp3 staining, n = 7 CD103 staining) and statistics. P‐values are indicated with *P < 0.05, **P < 0.01, ***P < 0.001, ****P < 0.0001, from non‐parametric Mann–Whitney test.
- Expression of PD‐1 on stimulated T cells from AhR‐WT and AhR‐KO CD4+ T cells. Upper plots show examples of flow cytometry data, and lower plots show all replicates (n = 5) and statistics. P‐values are indicated with *P < 0.05, **P < 0.01, ***P < 0.001, ****P < 0.0001, from non‐parametric Mann–Whitney test.
Data information: Bar plots show mean statistic value and error bars indicate s.d., Box‐and‐whisker plot show first and third quartile with median value indicated, and error bars indicate s.d.
Source data are available online for this figure.
