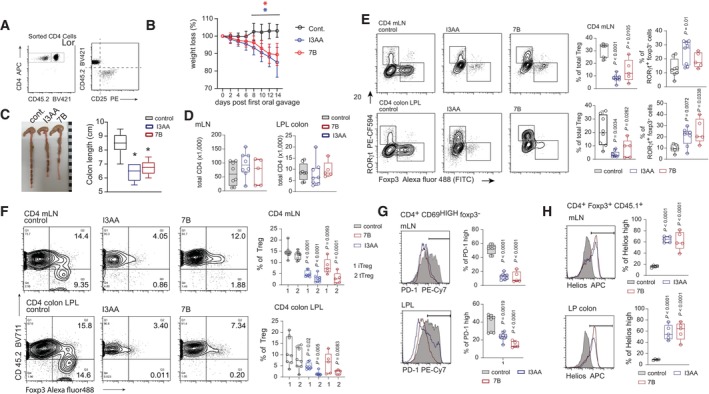
Figure 6. I3AA produced by Blastocystis ST7 induces experimental colitis by inducing Th17 and inhibiting Treg responses.

- Phenotype of T cells used for adoptive transfer into Rag2 −/− hosts. Before transfer into the host, naïve CD4+ T cells from CD45.2 and CD4+ tTreg from CD45.1 congenic strains were mixed in proportions to reconstitute the approximate natural distribution of these CD4+ compartments.
- Weight loss by the Rag2 −/− groups after treatment with I3AA alone or indole derivatives from Blastocystis cultures. Error bars indicate s.d. Non‐parametric Mann–Whitney test was utilized, * indicates statistical significance when P < 0.05.
- Colon length of control and mice treated with I3AA or Blastocystis‐derived metabolites.
- Total number of CD4+ T cells in mLN and colon LP from different groups.
- Foxp3+ and RORγt+ distribution within CD4+ T cells in mLN and colonic LP that developed in Rag2 −/− hosts from adoptively transferred cells.
- Distribution of the CD45.1+ and CD45.2+ Foxp3+ T cells developed in the Rag2 −/− hosts.
- PD‐1 expression on Foxp3−CD4+ compartment.
- Helios expression on tTreg from control and I3AA‐treated mice.
Data information: Box‐and‐whisker plot show first and third quartile with median value indicated, error bars indicate s.d. Statistical analysis was performed using two‐tailed t‐test with Welch correction (with exception of B). When P < 0.05 (experimental to control groups), values are indicated. Experimental and control groups comprised of: n = 8 for the control and I3AA‐treated groups, n = 5 for experiments with isolated metabolites from Blastocystis ST7B culture (A–G). Intracellular staining with a‐Helios antibody was performed on T cells isolated from five animals in each experimental group (H).
Source data are available online for this figure.
