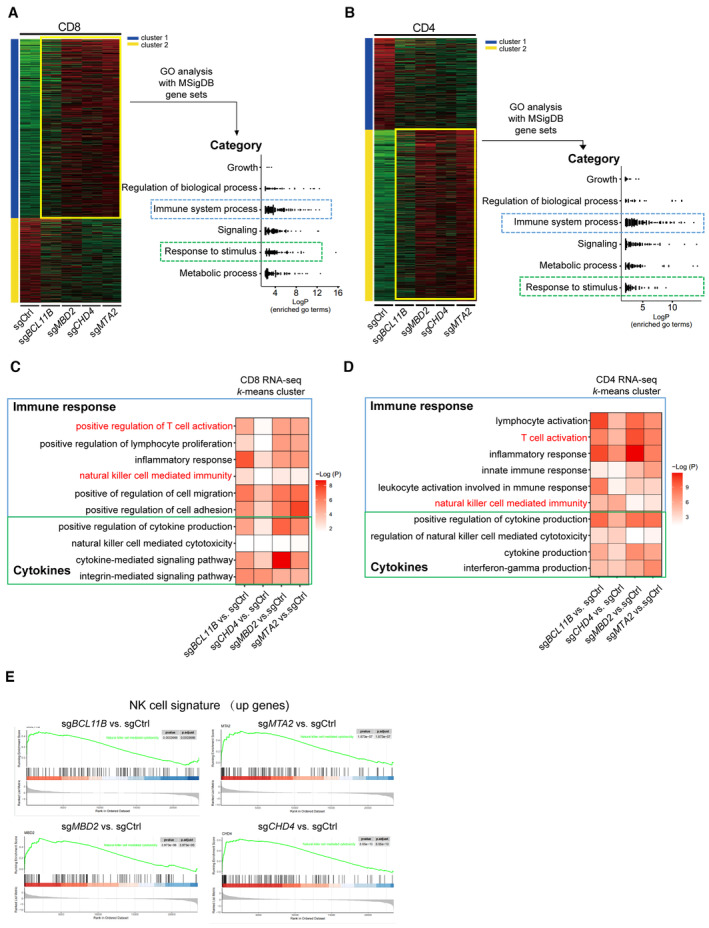
Figure EV1. ITNKs derived from NuRD‐subunit‐deficient cells have similar characteristics to BCL11B‐deleted ITNKs as compared with those of T cells.

- k‐means clustering analysis of differentially expressed genes in RNA‐seq transcriptomes revealed two distinct clusters of genes in purified CD8+NKp30+ subsets of T cells that were transduced with sgBCL11B, sgMTA2, sgMBD2, or sgCHD4 and CD8+ sgCtrl‐transduced T cells. Relative enrichment of gene sets in the k‐means cluster by hierarchical clustering heatmap analysis. Pathway enrichment (gene set and GO) was performed on cluster 1. Gene sets enriched in cluster 1 were binned into different categories and plotted.
- k‐means clustering of differentially expressed genes in purified CD4+NKp30+ subsets of T cells that were transduced with sgBCL11B, sgMTA2, sgMBD2, or sgCHD4 and CD4+ sgCtrl‐transduced T cells. Gene sets enriched in cluster 2 were binned into different categories and plotted.
- Representative gene sets enriched by Gene Ontology (GO) analysis of the k‐means clusters 1 from (A). GO enrichment analysis was performed by R package clusterprofile (version 4.6.2). The was visualized as heatmaps generated by customed R scripts using ggplot2 (version 3.4.0).
- Representative gene sets enriched by GO term k‐means clusters 2 from (B). GO enrichment analysis was performed by R package clusterprofile (version 4.6.2). The was visualized as heatmaps generated by customed R scripts using ggplot2 (version 3.4.0).
- GSEA enrichment plots for the indicated gene sets in the transcriptome of CD4+ CTL (enrichment plot: NATURAL_KILLER_CELL_MEDIATED_CYTOTOXICITY; Table EV1). The top portion of the plot shows the running enrichment score (RES) for the gene set as the analysis walks down the ranked list of genes and reflects the degree to which the gene set is overrepresented at the top or bottom of the ranked list of genes. The middle portion of the plot shows where the members of the gene set (indicated as black lines) appear in the ranked list of genes. The bottom portion of the plot shows the value of the ranking metric.
Source data are available online for this figure.
