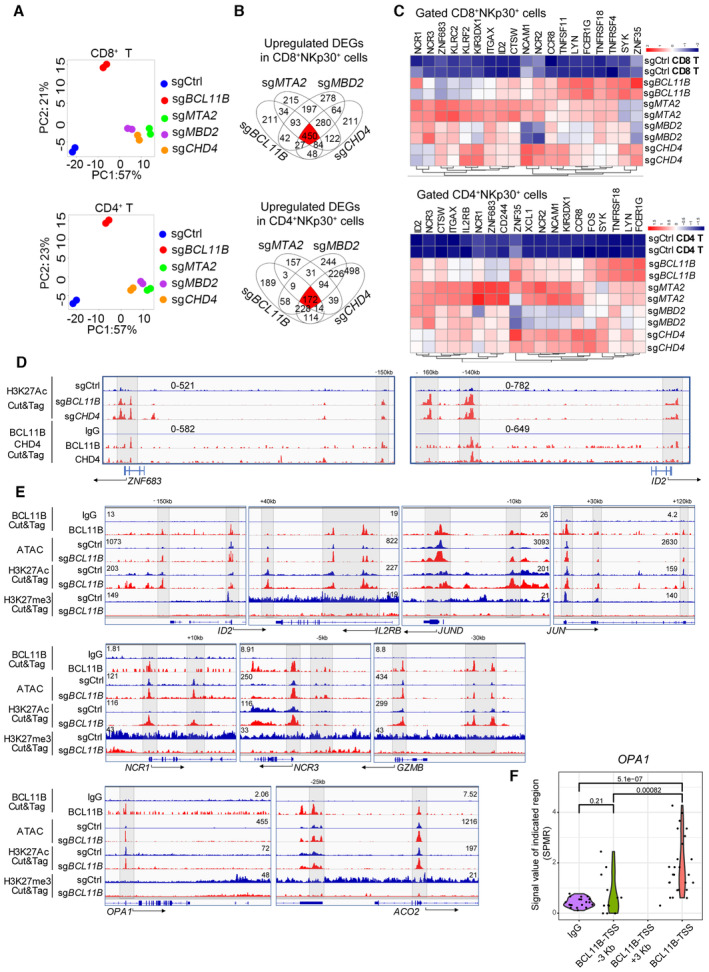
Figure 2. BCL11B associates with the NuRD complex to repress the expression of NK‐cell‐associated genes in human T cells.

- PBMC‐derived T cells from two healthy donors were transduced with sgCtrl, sgBCL11B, sgMTA2, sgMBD2, or sgCHD4 and cultured for 10 days. CD8+NKp30+ and CD4+NKp30+ cells (purity > 90%) were enriched from PBMC‐derived T cells transduced with sgBCL11B‐, sgMTA2‐, sgMBD2‐, and sgCHD4. CD4 and CD8 T cell subsets were enriched from T cells transduced with sgCtrl. Principal component analysis (PCA) was used to evaluate the similarities in the global gene expression profiles of the listed populations.
- Venn diagrams for the number of upregulated differentially expressed genes (DEGs) in (A) overlapping among CD8+NKp30+ (450 genes) and CD4+NKp30+ (172 genes) subsets from sgBCL11B‐, sgMTA2‐, sgMBD2‐, and sgCHD4‐transduced T cells, compared to CD8+ and CD4+ sgCtrl‐transduced T cells.
- Heatmap of the overlapping upregulated DEGs from (B).
- PBMC‐derived CD8+ T cells transduced with sgCtrl, sgBCL11B‐, and sgCHD4 were cultured for 10 days in vitro before CUT&Tag experiments. Selected genome views for the H3K27Ac CUT&Tag data for sgBCL11B‐ and sgCHD4‐transduced CD8+NKp46+ cells. H3K27Ac peak data for listed NK‐cell‐associated genes in the indicated T cells. The data are representative of two individual healthy donors. CUT&Tag analysis of the binding of CHD4 to the loci of these genes in CD8+ T cells. IgG antibodies were used as a blank control.
- PBMC‐derived T cells transduced with sgCtrl and sgBCL11B were cultured for 10 days in vitro. T cells were harvested and extracted DNA fragments marked by BCL11B antibody; sgCtrl‐transduced T cells and sgBCL11B‐transduced T cells (CD3+NKp46+) were harvested and extracted DNA fragments marked by H3K27Ac antibody and H3K27me3 antibody for CUT&Tag sequencing, respectively. These sgCtrl‐transduced T cells and sgBCL11B‐transduced T cells (CD3+NKp46+) were also lysed to extract nuclei for ATAC‐seq profile. Selected genome views for the BCL11B, H3K27Ac CUT&Tag, and ATAC‐seq data of T cells. CUT&Tag analysis of the binding of BCL11B to the loci of NK‐related genes, AP‐1, and metabolism‐related genes in T cells. IgG antibodies were used as a blank control. ATAC‐seq data of sgCtrl T cells and corresponding sgBCL11B T cells are shown in views of the indicated gene loci. H3K27Ac and H3K27me3 peak data of sgCtrl T cells and corresponding sgBCL11B T cells are shown in views of the indicated gene loci. The data are representative of two individual healthy donors.
- Violin plot of the distribution of BCL11B binding peaks spanning 3 kb upstream to downstream of the TSS region of the OPA1 gene (BCL11B CUT&Tag data from (E)). SPMR: signal per million reads.
Data information: In (F), the points represent the windows with signal values in the CUT&Tag data (N = 10–25 signal values per region). We extracted the signal values from the bedgraph file generated by MACS2, and used two‐tailed unpaired Student's t‐test to evaluate the significant differences between the data.
Source data are available online for this figure.
