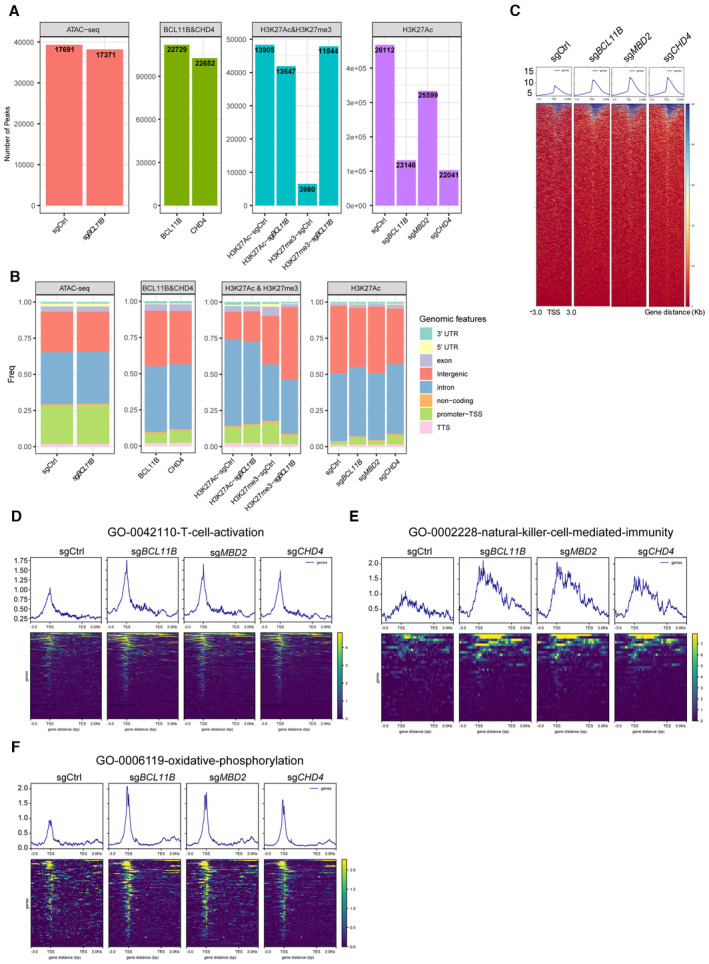
Figure EV2. ITNKs increase the H3K27Ac at TSS region of pluripotency gene sets.

- Bar chart indicating the number of peaks and the number of genes at the peak position in these omics‐seq.
- Bar chart demonstrating the percentage of peaking with a TSS, TSS‐promoter, transcription end site (TES), and other sites in these omics‐seq.
- Tag density pileups of H3K27Ac peaks in CD8+ T cells transduced with sgBCL11B, sgMBD2, or sgCHD4 and CD8+ sgCtrl‐transduced T cells. Two individual healthy donors were used for the CUT&Tag assay.
- Tag density pileups of H3K27Ac peaks at the T‐cell‐activation gene set (see Table EV2) in CD8+ T cells transduced with sgBCL11B, sgMBD2, or sgCHD4 and CD8+ sgCtrl‐transduced T cells.
- Tag density pileups of H3K27Ac peaks at the natural‐killer‐cell‐mediated‐immunity gene set (see Table EV3) in CD8+ T cells transduced with sgBCL11B, sgMBD2, or sgCHD4 and CD8+ sgCtrl‐transduced T cells.
- Tag density pileups of H3K27Ac peaks at the oxidative‐phosphorylation gene set (see Table EV4) in CD8+ T cells transduced with sgBCL11B, sgMBD2, or sgCHD4 and CD8+ sgCtrl‐transduced T cells.
Source data are available online for this figure.
