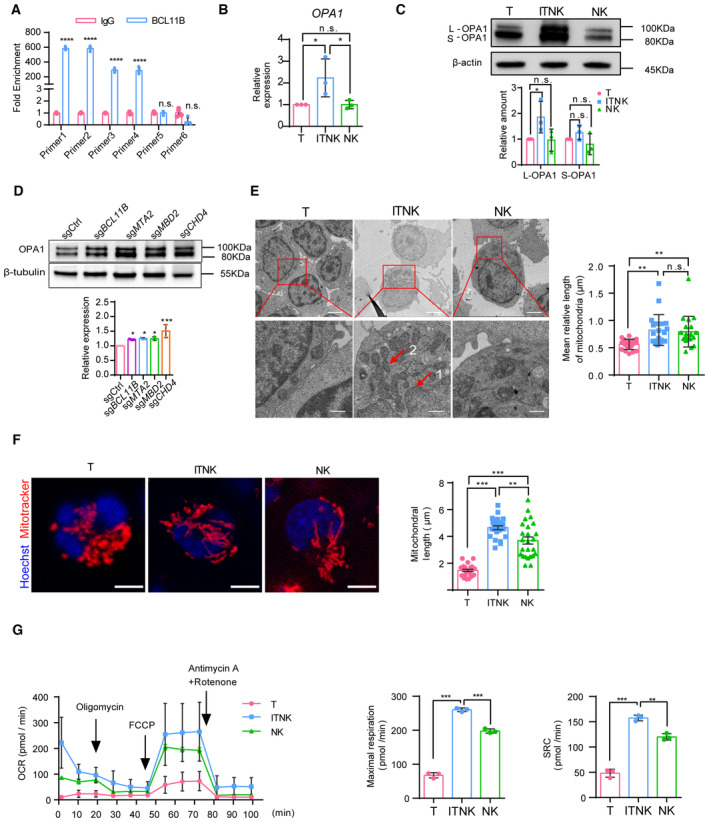
Figure 3. ITNKs contain fused mitochondria with enhanced metabolic function.

- Quantifying the fold enrichment of OPA1 at different binding sites of BCL11B using CUT&Tag‐qPCR.
- Relative mRNA levels of OPA1 in samples of human T cells, ITNKs (CD3+NKp46+), and NK cells (CD3−CD56+) based on quantitative RT‐PCR.
- Western blot analysis of mitochondrial fusion protein OPA1 levels in samples of human T cells, ITNKs (CD3+NKp46+), and NK cells (CD3−CD56+). Graph summarizing the relative protein levels of OPA1, including the long‐form OPA1 (L‐OPA1) and the short‐form OPA1 (S‐OPA1), in ITNKs compared to T cells.
- Western blot analysis of OPA1 protein levels in ITNKs that were derived from T cells transduced with sgBCL11B, sgMTA2, sgMBD2, or sgCHD4 and sgCtrl‐transduced T cells.
- Transmission electron micrograph of purified T, ITNK, and NK cells from Appendix Fig S3C. ITNKs had a low nucleocytoplasmic ratio compared to T cells. 1, nucleus; 2, mitochondria. Scale bar, 2 μm (top) and 500 nm (bottom).
- Confocal microscopy images showing purified T cells, ITNKs, and NK cells in which the mitochondria (MitoTracker; red) and nuclei (Hoechst; blue) are stained. Scale bars: 5 μm. Each dot represents the mean relative length of the mitochondria in a sample.
- ITNKs, T cells, and NK cells derived from the same donors who provided PBMCs were cultured for 10 days without activation or priming before assaying, and cell metabolism was analyzed. OXPHOS (OCR: O2 consumption rate) assays were performed in real‐time after injection of oligomycin (2 μM), FCCP (1 μM), and antimycin A (1 μM) plus rotenone (1 μM) as indicated.
Data information: In (A–G), data are presented as mean ± SD, N = 3 (B–G) or N = 4 (A) individual healthy donors. N = 20 (E) and N = 25 (F) mitochondria per replicate. *P ≤ 0.05, **P ≤ 0.01, ***P ≤ 0.001 and ****P ≤ 0.0001, two‐tailed paired Student's t‐test (B–D), one‐way ANOVA with Tukey's multiple comparisons test (E–G) or two‐way ANOVA with Sidak's multiple comparisons test (A).
Source data are available online for this figure.
