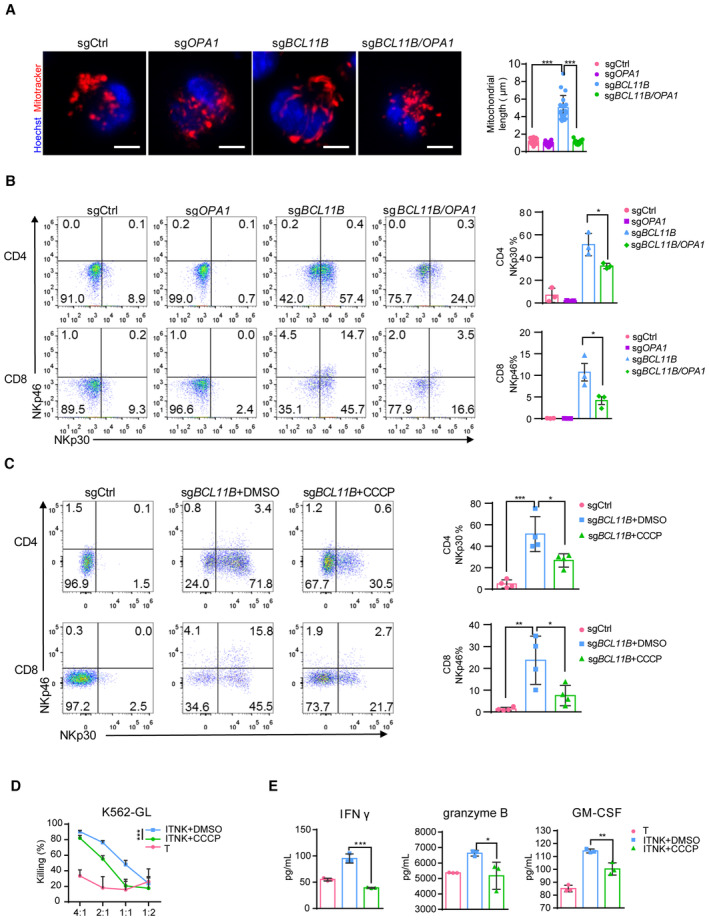
Figure 4. OPA1‐mediated mitochondrial fusion facilitates the reprogramming of ITNKs and their cytotoxicity.

- Confocal microscopy images showing T cells transduced with sgCtrl, sgOPA1, sgBCL11B, or sgBCL11B/OPA1 in which the mitochondria (MitoTracker, red) and nuclei (Hoechst; blue) are stained. Scale bars: 5 μm. Mean lengths of the 20 mitochondria per replicate, as analyzed by confocal microscopy, are shown.
- Representative flow cytometric analysis of NKp30 and NKp46 expression in T cells transduced with sgCtrl, sgOPA1, sgBCL11B, or the combination of sgBCL11B and sgOPA1. A graph summarizing the percentages of NKp30+ cells in CD4+ T cells and percentages of NKp46+ cells in CD8+ T cells transduced with sgCtrl, sgOPA1, sgBCL11B, or the combination of sgBCL11B and sgOPA1 is in the right panel.
- CCCP (5 μM, mitochondrial fission inducer) was added to a culture of sgBCL11B‐transduced human T cells derived from PBMCs 24 h after electroporation. Ten days later, the T cells were subjected to FACS analysis. A graph summarizing the percentages of NKp30+ and NKp46+ cells in CD4+ and CD8+ T cells transduced with sgCtrl, sgBCL11B, or sgBCL11B and treated with CCCP is shown in the right panel.
- Killing assays showing the percent cytotoxicity of T cells, ITNKs, and ITNKs treated with CCCP from (C) against K562 cells. The data represents killing percentage of cells from a donor.
- Cytokine secretion profiles of T cells, ITNKs, and ITNKs treated with CCCP and cocultured with K562 cells. T cells, ITNKs, and ITNKs treated with CCCP from (C) were incubated with K562 cells at an E:T ratio of 1:1 for 24 h. The supernatants were then harvested, and the concentrations of the indicated cytokines were measured by a multiplex immunoassay. The data represents the concentrations of the indicated cytokines from (D).
Data information: In (A, B, D and E), data are presented as mean ± SD, N = 3 or N = 4 (C) individual healthy donors. *P ≤ 0.05, **P ≤ 0.01 and ***P ≤ 0.001, two‐tailed paired Student's t‐test (B–D), one‐way ANOVA (A–C) or two‐way ANOVA (D and E) with Tukey's multiple comparisons test.
Source data are available online for this figure.
