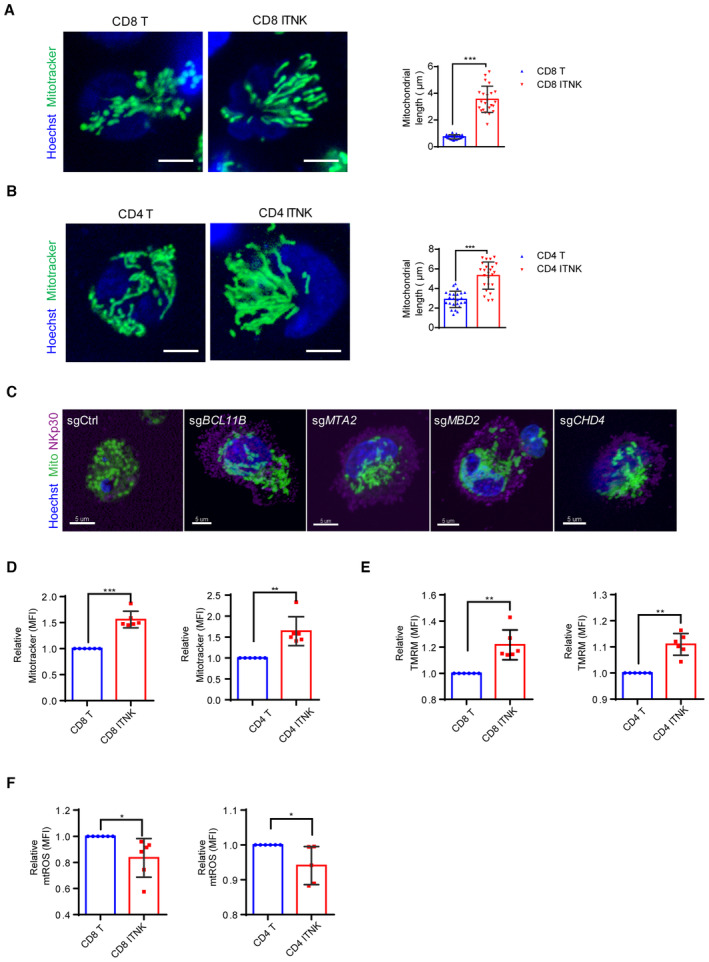
Figure EV4. Mitochondrial morphology and functions of ITNKs.

- Confocal microscopy images showing purified CD8+ T cells and CD8+NKp30+ ITNKs in which the mitochondria (MitoTracker; green) and nuclei (Hoechst; blue) are stained. Each dot represents the mean relative length of the 24 mitochondria per replicate. Scale bars: 5 μm.
- Confocal microscopy images showing purified CD4+ T cells and CD4+NKp30+ ITNKs in which the mitochondria (MitoTracker; green) and nuclei (Hoechst; blue) are stained. Each dot represents the mean relative length of the 24 mitochondria per replicate. Scale bars: 5 μm.
- ITNKs that were derived from T cells transduced with sgBCL11B, sgMTA2, sgMBD2, or sgCHD4 or sgCtrl‐transduced T cells were cultured for 10 days for observation of mitochondrial morphology. Confocal microscopy images are shown; mitochondria (MitoTracker; green); nuclei (Hoechst; blue), and NKp30 (purple) are stained. Scale bars: 5 μm.
- CD4+NKp30+ and CD8+NKp30+ ITNKs derived from sgBCL11B‐transduced T cells were purified and assessed the mitochondrial functions by FACS. CD8+ T cells and CD8+NKp30+ ITNKs (left) and CD4+ T cells and CD4+NKp30+ ITNKs (right) were stained with MitoTracker green and analyzed by flow cytometry.
- CD8+ T cells and CD8+NKp30+ ITNKs (left) and CD4+ T cells and CD4+NKp30+ ITNKs (right) were stained with TMRM and analyzed by flow cytometry.
- CD8+ T cells and CD8+NKp30+ ITNKs (left) and CD4+ T cells and CD4+NKp30+ ITNKs (right) were stained with MitoSOX and analyzed by flow cytometry.
Data information: In (A, B, and D–F), data are presented as mean ± SD, N = 3 (A and B) or 6 (D–F) individual healthy donors. *P ≤ 0.05, **P ≤ 0.01, and ***P ≤ 0.001, two‐tailed paired Student's t‐test.
Source data are available online for this figure.
