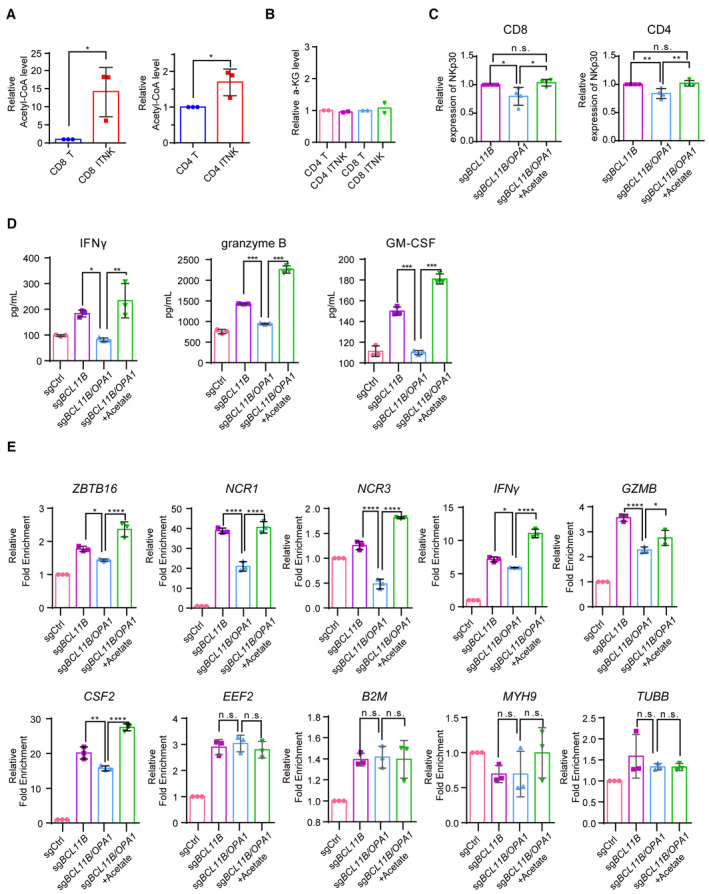
Figure EV5. Acetate restored the reprogramming efficacy and function of ITNKs.

- Relative acetyl‐CoA levels in CD8+ (left) and CD4+ (right) ITNKs on Day 10 that were reprogrammed from T cells transduced with sgBCL11B and sgCtrl‐transduced T cells.
- Relative α‐KG levels in CD4+ (left) and CD8+ (right) ITNKs on Day 10 that were reprogrammed from T cells transduced with sgBCL11B and sgCtrl‐transduced T cells.
- Graph summarizing the percentages of NKp30+ in CD4 T cells and CD8 T cells transduced with sgBC11B or the combination of sgBCL11B and sgOPA1 and treated with or without acetate (from Fig 5B).
- Cytokine secretion profiles of T cells and ITNKs from Fig 5C that were incubated with HepG2 cells at an E:T ratio of 1:1 for 24 h. The supernatants were then harvested, and the concentrations of the indicated cytokines were measured by a multiplex immunoassay.
- Relative mRNA levels of ZBTB16, NCR1, NCR2, NCR3, IFNγ, CSF2, and GZMB in T cells and ITNKs from Fig 5A, housekeeping genes (EEF2, B2M, MYH9, and TUBB) as negative controls, measured by quantitative RT‐PCR.
Data information: In (A–E), data are presented as mean ± SD, N = 2 (B) or 3 (A and C–E) individual healthy donors. *P ≤ 0.05, **P ≤ 0.01, ***P ≤ 0.001 and ****P ≤ 0.0001, two‐tailed paired Student's t‐test (A) or one‐way ANOVA with Tukey's multiple comparisons test (C–E).
Source data are available online for this figure.
