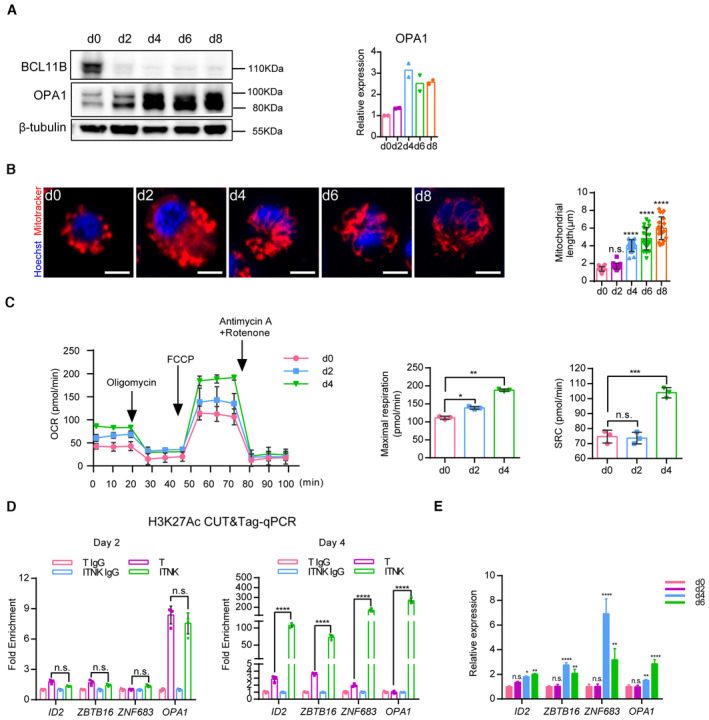
Figure 6. ITNKs acquire the NK‐cell identity through a metabolic‐epigenetic axis.

- Representative western blot analysis of BCL11B and OPA1 protein levels in ITNKs from Days 0 to 8.
- Representative confocal microscopy images showing ITNKs from Days 0 to 8 in the reprogramming process in which the mitochondria (MitoTracker; Red) and nuclei (Hoechst; blue) are stained. Scale bars: 5 μm. Each dot represents the mean length of the 20 mitochondria per replicate.
- Mitochondrial‐stress test on Days 2 and 4 of ITNKs.
- CUT&Tag‐qPCR analysis of H3K27Ac enrichment in the promoter regions of indicated genes on Days 2 and 4 of ITNKs.
- Time‐course analysis of NK‐related transcription factors and OPA1 expression by RT‐qPCR.
Data information: In (A–E), data are presented as mean ± SD, N = 2 (A and B) or 3 (C) or 4 (D and E) individual healthy donors. *P ≤ 0.05, **P ≤ 0.01, ***P ≤ 0.001 and ****P ≤ 0.0001, one‐way (C) or two‐way (E) ANOVA with Dunnett's multiple comparisons test, or two‐way ANOVA with Bonferroni's multiple comparisons test (D).
Source data are available online for this figure.
