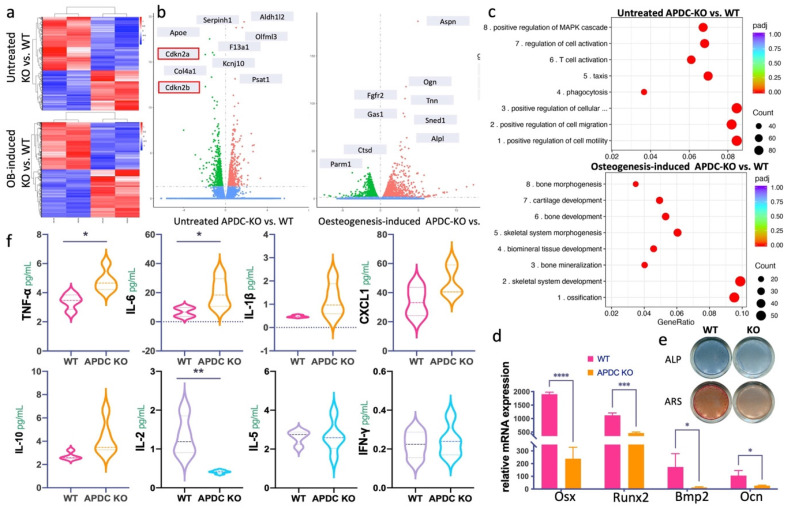
Figure 2.
The impact of APDC on inflammation related cytokines and bone metabolism. a) the heatmap of untreated (day0) BMSCs (upper) and osteogenic differentiated (day3) BMSCs (lower) comparing between APDC KO and control mice. b) the volcano plot with top genes marked (WT vs. KO). c) the GO enrichment results at untreated (upper) and osteogenesis-induced (lower) groups. d) the mRNA expression level of the osteogenic markers. e) ALP and ARS staining results (upper) and the mRNA expression level of osteogenesis related genes (lower) for APDC KO and control mice. f) the serum level of cytokines (IL-1β, IL-6, CXCL1, TNF-α, IL-10, IL-2, IL-5 and IFN-γ) (n=5). Values are shown as mean± SD. * p < 0.05, ***p < 0.001, ****p < 0.0001.

