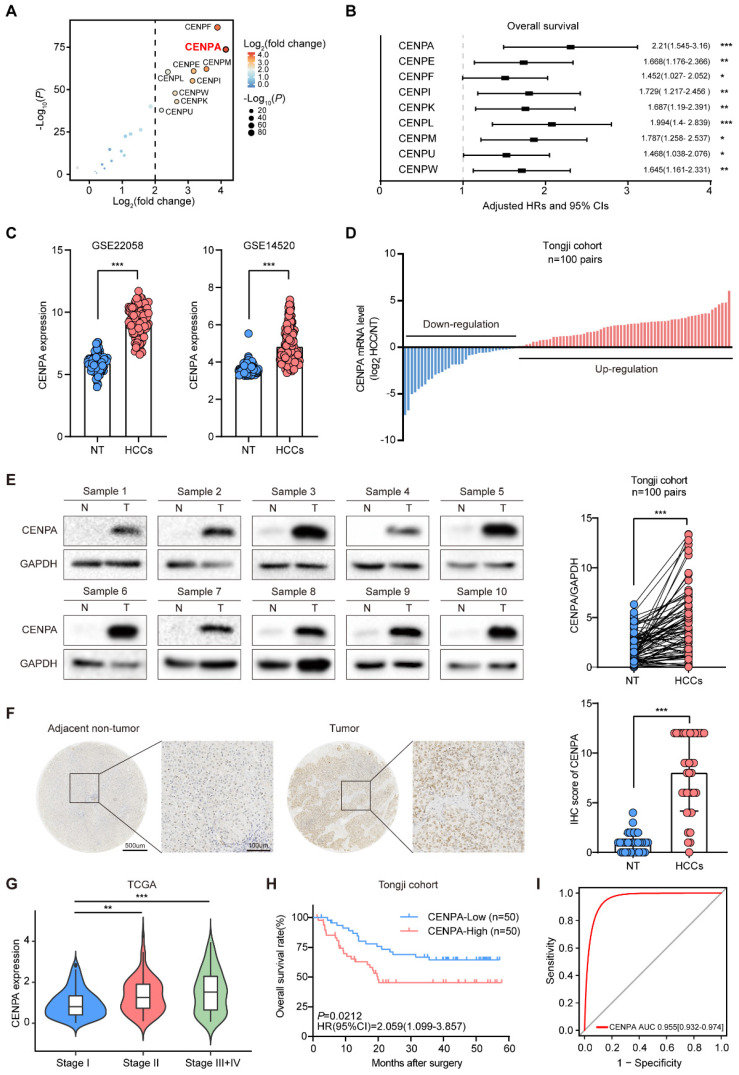
Figure 1.
High expression of CENPA correlates with poor outcomes in HCC patients. (A) Comparison of CENPs family member expression between tumor tissues and normal tissues in TCGA cohort. The horizontal axis shows differences in gene expression between tumor tissues and normal tissues, and the vertical axis shows the significant of the differences. The color of the points in the figures represents the fold differences, and the size of the points represents the significance of the difference. P values by two-side Students t test. (B) Association of CENPs family member expression with patient OS times in TCGA cohort based on univariate cox regression analysis. HR>1 indicates that the gene is a risk factor. (C) CENPA mRNA expression in HCC tissues and adjacent non-tumor tissues of patients in GSE22058 and GSE14520. NT, adjacent normal tissues. HCCs, hepatocellular carcinoma tissues. (D) Differential expression of the CENPA mRNA in 100 paired HCC tissues and adjacent non-tumor tissues of patients in Tongji cohort as determined by qRT-PCR. (E) CENPA protein level in 100 paired nontumor (N) and tumor (T) liver tissues from Tongji cohort as determined by western blotting, the band intensity was calculated by Image J software (P<0.0001). GAPDH was used as loading control. (F) Representative IHC staining images of the CENPA expression in HCC and adjacent tissues in Tongji HCC TMA cohort and a statistical evaluation of the staining intensity (P<0.0001). Scale bars=500um or 100um, respectively. (G) The expression of CENPA of HCC patients classified with pathological grades in TCGA database. (H) Kaplan-Meier analysis of overall survival rate for HCC patients based on CENPA expression in the Tongji cohort (P=0.0212). (I) ROC curve of high-expressed CENPA to evaluate the diagnosis efficiency of HCC. Data are shown as mean ± SEM; n = 3 independent experiments. The statistical significance was determined by Student's two-tailed t test. *P < 0.05; **P < 0.01; ***P < 0.001.

