Figure 3.
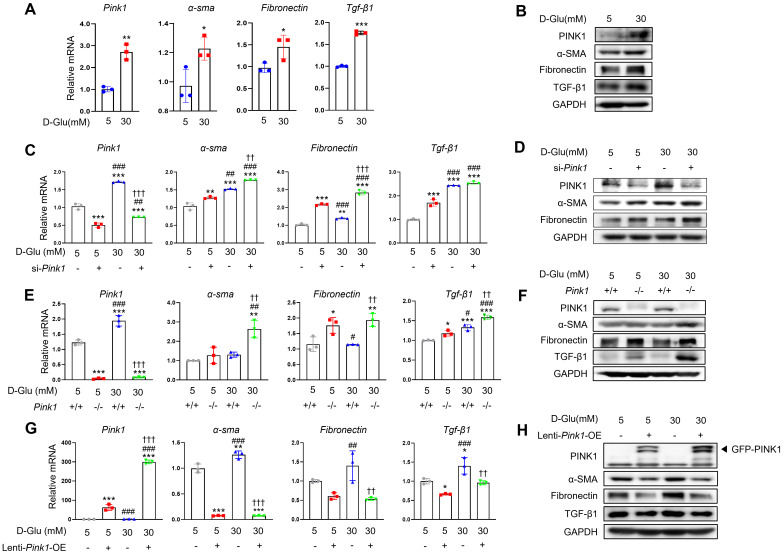
PINK1 regulates the profibrotic phenotypes of renal tubular epithelial cells under high glucose conditions. (A) mRNA levels of Pink1, α-SMA, fibronectin, and TGF-β1 in human renal proximal tubular cells (HKC-8) after treatment with 5- or 30-mM D-glucose. (B) Western blotting of PINK1, α-SMA, fibronectin, and TGF-β1 in HKC-8 cell lysates after treatment with 5- or 30-mM D-glucose. (C) Quantification of the expression of Pink1, α-SMA, fibronectin, and TGF-β1 mRNAs in HKC-8 cells with control siRNA or Pink1 siRNA under 5- or 30-mM D-glucose. (D) Western blotting of PINK1, α-SMA, and fibronectin in control or PINK1 siRNA-treated HKC-8 cells under 5- or 30-mM D-glucose. (E) Quantification of the expression of Pink1, α-SMA, fibronectin, and TGF-β1 mRNA in primary renal tubular epithelial cells of Pink1+/+ and Pink1-/- mice after treatment with 5- or 30-mM D-glucose. (F) Western blotting of α-SMA, fibronectin, and TGF-β1 in 5- or 30-mM D-glucose-treated primary renal tubular epithelial cells obtained from Pink1+/+ or Pink1-/- mice. (G) Quantification of the expression of Pink1, α-SMA, fibronectin, and TGF-β1 mRNA in control or GFP-Pink1 infected HKC-8 cells after treatment with 5- or 30-mM D-glucose. (H) Western blotting of α-SMA, fibronectin, and TGF-β1 in PINK1-overexpressed HKC-8 cells after treatment with 5- or 30-mM D-glucose. Quantitative analysis of Figure 3B, 3D, 3F, and 3H are shown in Figure S2. Shown are representatives of three independent experiments and are expressed as means ± standard error. *p < 0.05, **p < 0.01, ***p < 0.001 vs Pink1+/+ NG, #p < 0.05, ##p < 0.01 vs Pink1-/- NG, ††p < 0.01, †††p < 0.001 vs Pink1+/+ DM. Abbreviations: PINK1, PTEN-induced serine/threonine kinase; α-SMA, alpha-smooth muscle actin; TGF-β1, transforming growth factor-β1; NG, normal glucose; DM, diabetes mellitus; GAPDH, glyceraldehyde 3-phosphate dehydrogenase; OE, overexpression; GFP, green fluorescent protein.

