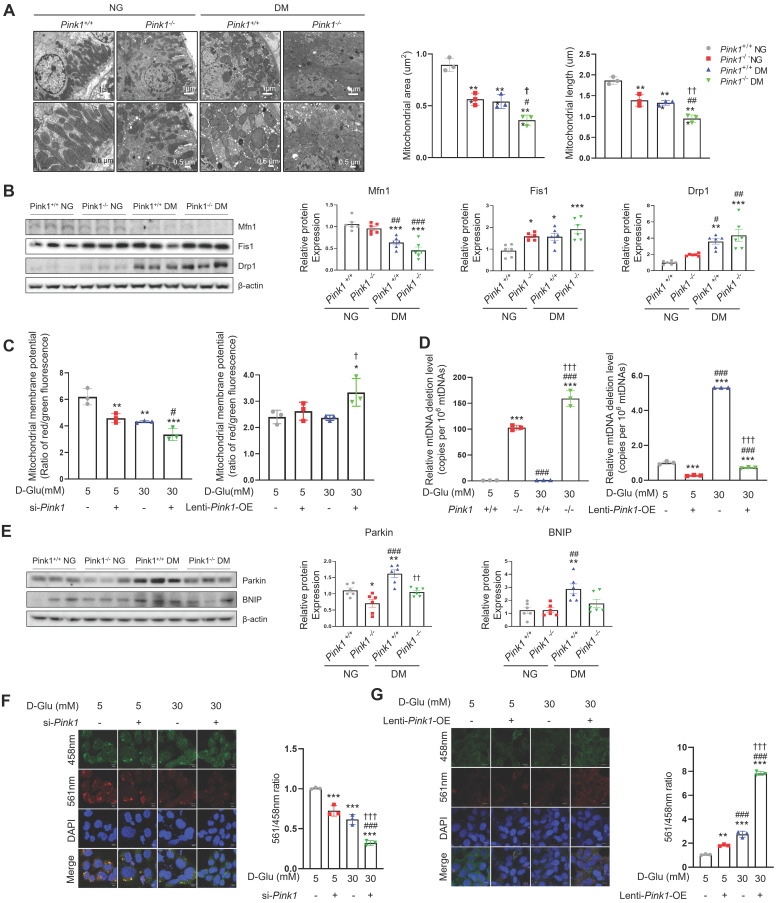
Figure 4.
PINK1 maintain mitochondrial homeostasis and mitophagic function in renal tubular epithelial cells under high glucose conditions. (A) Representative electron microscopy images and the quantification of mitochondrial area and length in renal proximal tubular epithelial cells of Pink1+/+ and Pink1-/- mice with normal or high serum glucose levels. (B) Western blotting of mitofusin 1 (Mfn1), mitochondrial fission 1 (Fis1), and dynamin-related protein 1 (Drp1) in the kidneys of Pink1+/+ and Pink1-/- mice with normal or high serum glucose levels, and their quantification. (C) The mitochondrial membrane potential of HKC-8 cells with Pink1 siRNA and GFP-Pink1 infected HKC-8 cells after treatment with 5- or 30-mM D-glucose. (D) The mouse mitochondrial DNA 3,860-bp deletion in primary cultures of kidney proximal tubule cells obtained from Pink1+/+ or Pink1-/- mice and the human mitochondrial DNA 4,977-bp deletion in control or GFP-Pink1 infected HKC-8 cells after treatment with 5- or 30-mM D-glucose. (E) Western blotting of Parkin and Bcl-2/adenovirus E1B 19 kD-interacting protein 3 (BNIP3) in the kidneys of Pink1+/+ and Pink1-/- mice with normal or high serum glucose levels, and their quantification. (F) Representative fluorescence images of the mt-Keima and their quantification in HKC-8 cells with control or Pink1 siRNA after treatment with 5- or 30-mM D-glucose. (G) Representative fluorescence images of the mt-Keima and their quantification in control or GFP-Pink1 infected HKC-8 cells after treatment with 5- or 30-mM D-glucose. Scale bar: (A) 1 μm and 0.5 μm in upper and lower images, respectively, (F and G) 10 μm. (A, B, and E) n = 6 per group. (C, D, F, and G) Data are representative of three independent experiments and are expressed as means ± standard error. n = 3 per group. **p < 0.01, ***p < 0.001 vs Pink1+/+ NG, #p < 0.05, ##p < 0.01, ###p < 0.001 vs Pink1-/-, NG, †p < 0.05, ††p < 0.01, †††p < 0.001 vs Pink1+/+ DM. Abbreviations: PINK1, PTEN-induced serine/threonine kinase 1; NG, normal glucose; DM, diabetes mellitus; Mfn, mitofusin 1; Fis1, mitochondrial fission 1; Drp1, dynamin-related protein 1; OE, overexpression; mtDNA, mitochondrial DNA; BNIP, Bcl-2/adenovirus E1B 19 kD-interacting protein 3; mt-Keima, mitochondria-targeted Keima.

