Figure 2.

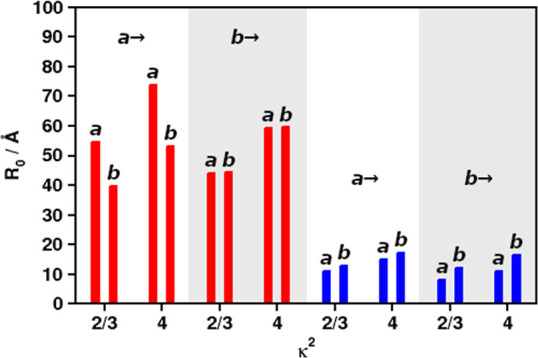
R0 for Q–Q (red) and B–B (blue) FRET, using different values of κ2 and different donor/acceptor combinations of Chls a and b (left and right in each column pair). Donors indicated above each column quartet.

R0 for Q–Q (red) and B–B (blue) FRET, using different values of κ2 and different donor/acceptor combinations of Chls a and b (left and right in each column pair). Donors indicated above each column quartet.