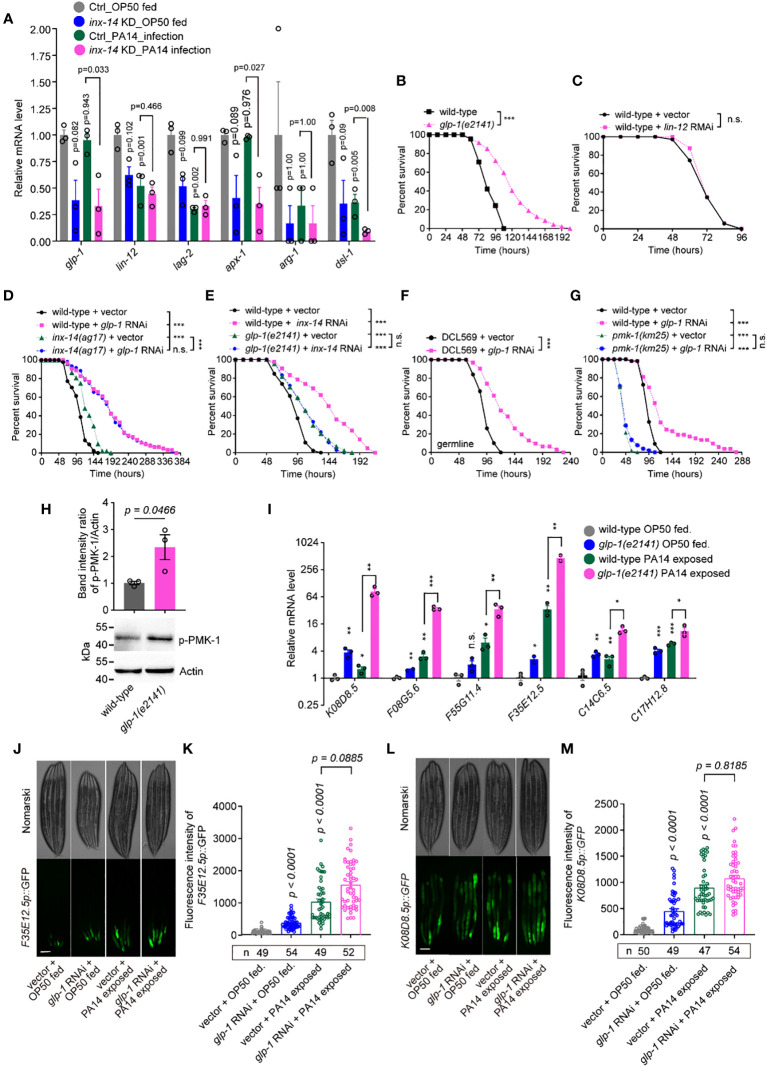
Figure 4.
GLP-1/Notch signaling acts downstream of INX-14 in the germline to suppress the intestinal defense. (A) Normalized expression levels of Notch signaling pathway components glp-1, lin-12, lag-2, apx-1, arg-1 and dsl-1 in the transcriptome profile of germline-specific RNAi strain DCL569. Ctrl, L4440 vector control; inx-14 KD indicates inx-14 knockdown by germline-specific RNAi. (B, C) Survival assay of wild-type and glp-1(e2141) mutant (B), or of animals fed on vector control or lin-12 RNAi bacteria (C). (D) Survival assay of wild-type and inx-14(ag17) mutant animals fed on vector control or glp-1 RNAi bacteria. (E) Survival assays of wild-type and glp-1(e2141) mutants fed on vector control or inx-14 RNAi bacteria, prior to PA14 exposure. (F) Survival assays of the germline-tissue-specific RNAi strain DCL569 fed on vector control or inx-14 RNAi bacteria prior to PA14 exposure. (G) Survival assays of wild-type and pmk-1(km25) mutant animals fed on vector control or glp-1 RNAi bacteria, prior to PA14 exposure. (H) Representative western blot images and quantitative analysis of the phosphorylation level of PMK-1/p38 in wild-type and glp-1(e2141) mutant animals upon PA14 exposure. (I) RT-qPCR analysis of the expression levels of six PMK-1/p38-dependent genes in wild-type and glp-1(e2141) mutants fed on OP50 or exposed to PA14. The exact P values of statistics for comparison of qRT-PCR between groups are listed in Supplementary Table S2 . (J–M) Representative images (J, L) and quantification (K, M) of PMK-1/p38 pathway-dependent gene reporters F35E12.5p::GFP (J, K) and K08D8.5p::GFP (L, M), fed on vector control or inx-14 RNAi bacteria, prior to OP50 feeding or exposure to PA14. All experiments were repeated at least three times. The number of animals analyzed is indicated in (K, M). Column data with plots are presented as mean ± SEM. Statistical significance was determined by log-rank test for survival assay, or non-parametric test for (H), or Kruskal–Wallis with Dunn’s multiple comparison test for (I), (K), and (M). *P < 0.05; **P < 0.01; ***P < 0.001; n.s., not significant. Scale bar, 100 μm in (J, L).

