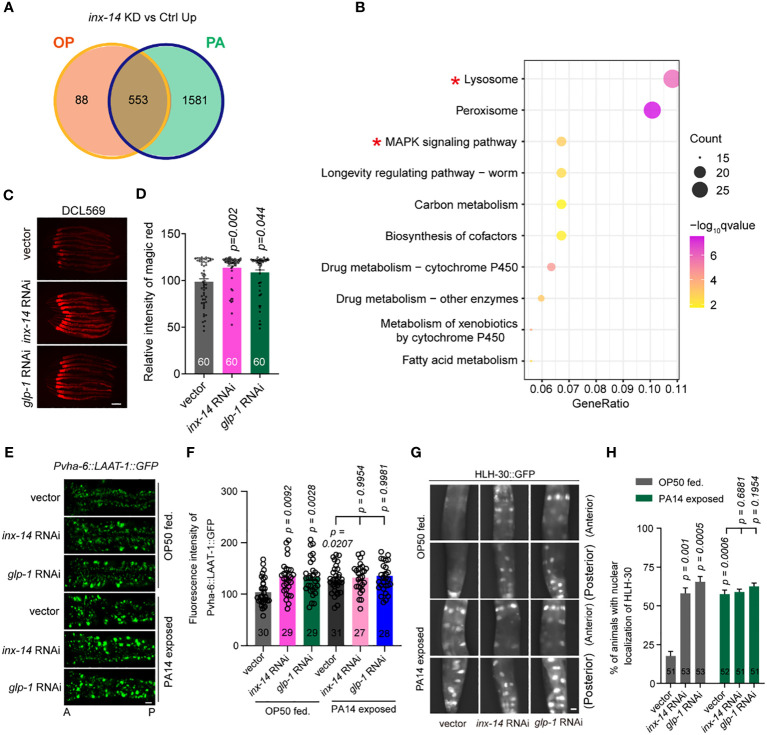
Figure 5.
Knock-down of inx-14 and glp-1 upregulates a lysosome pathway. (A) Venn diagram of genes up-regulated upon germline-specific inx-14 knock-down in OP50 or PA14 exposed animals. (B) KEGG pathway enrichment analyses of the up-regulated genes upon PA14 infection and inx-14 RNAi knock-down. Two red asterisks mark the MAPK signaling and lysosome pathways. KEGG terms were sorted according to numbers of enriched differentially-expressed genes. (C, D) Representative images (C) and quantitative analysis (D) of Magic Red Cathepsin assay in the germline-specific RNAi strain DCL569. (E–H) Representative images (E, G) and quantitative analysis (F, H) of transgenic worms expressing LAAT-1::GFP in the intestine (E, F), or HLH-30::GFP (G, H) fed on vector control, inx-14, or glp-1 RNAi bacteria, prior to OP50 feeding or PA14 infection for 24 (h) Statistical significance was determined by Kruskal–Wallis with Dunn’s multiple comparison test and the exact P value is indicated for (D, F, H). Scale bar, 100 μm in (C, E, G). Two red asterisks mark the enriched signaling pathways of lysosome and MAPK signaling pathways, respectively.

