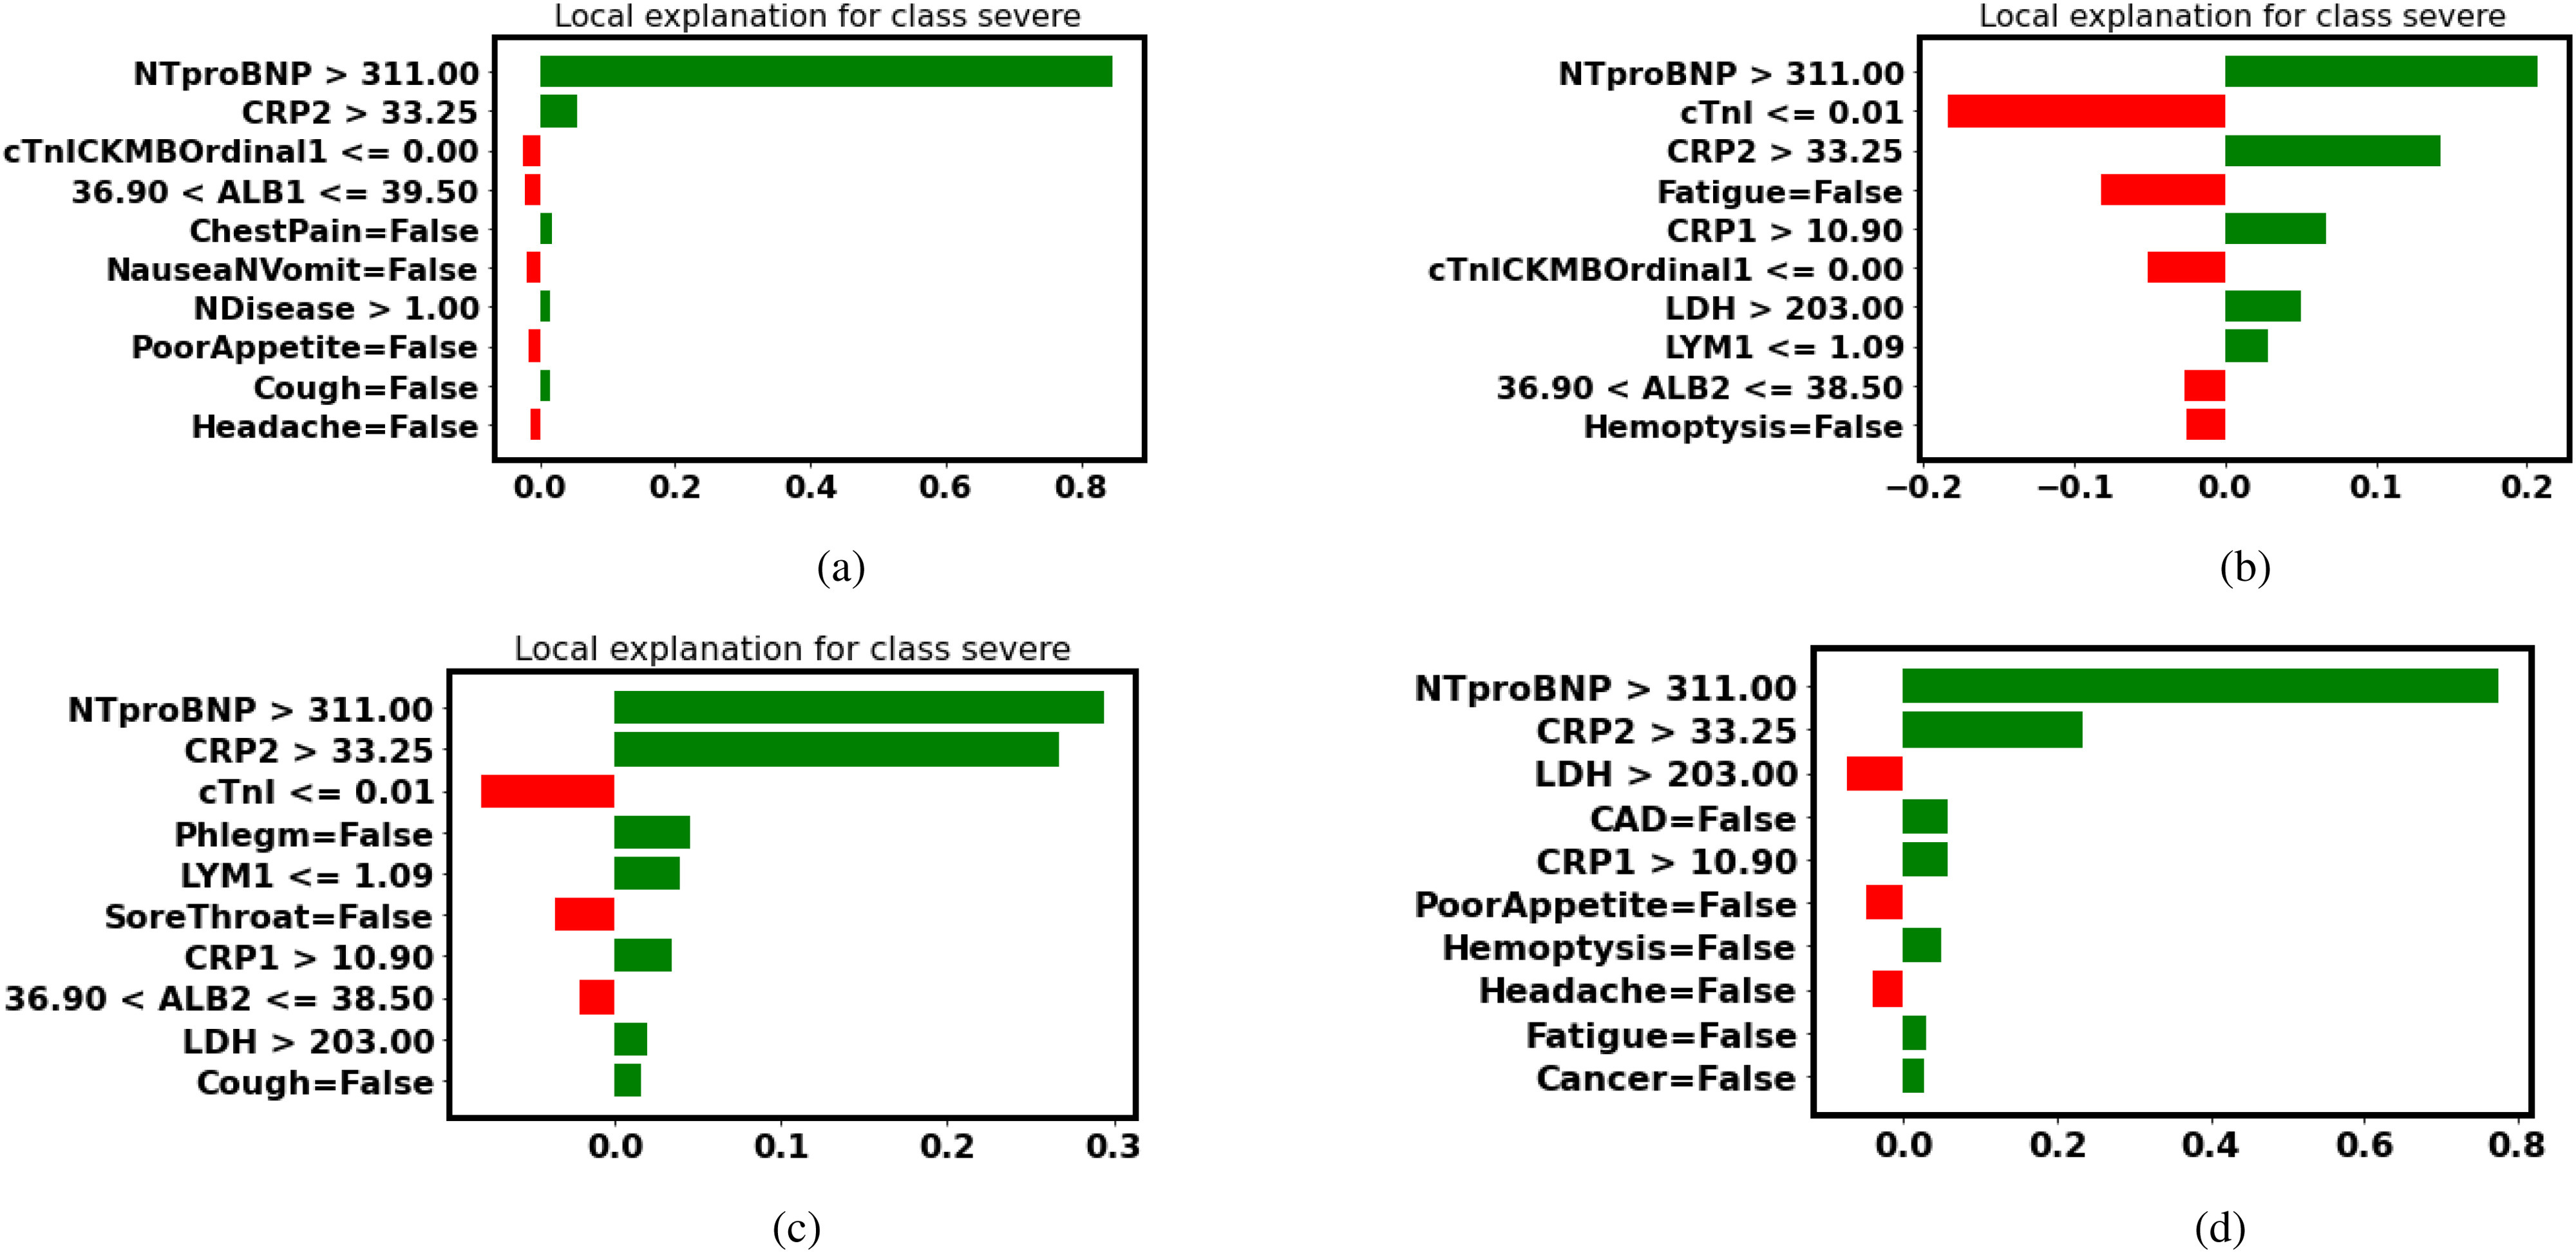
Fig. 7.

LIME explanation (false-positive patient No.2): Features in green have a positive contribution to the prediction (increasing the probability of turning severe), and features in red have a negative effect on the prediction (decreasing the probability of turning severe). (a) Decision Tree. (b) Random Forest. (c) Gradient Boosted Trees. (d) Neural Networks.
