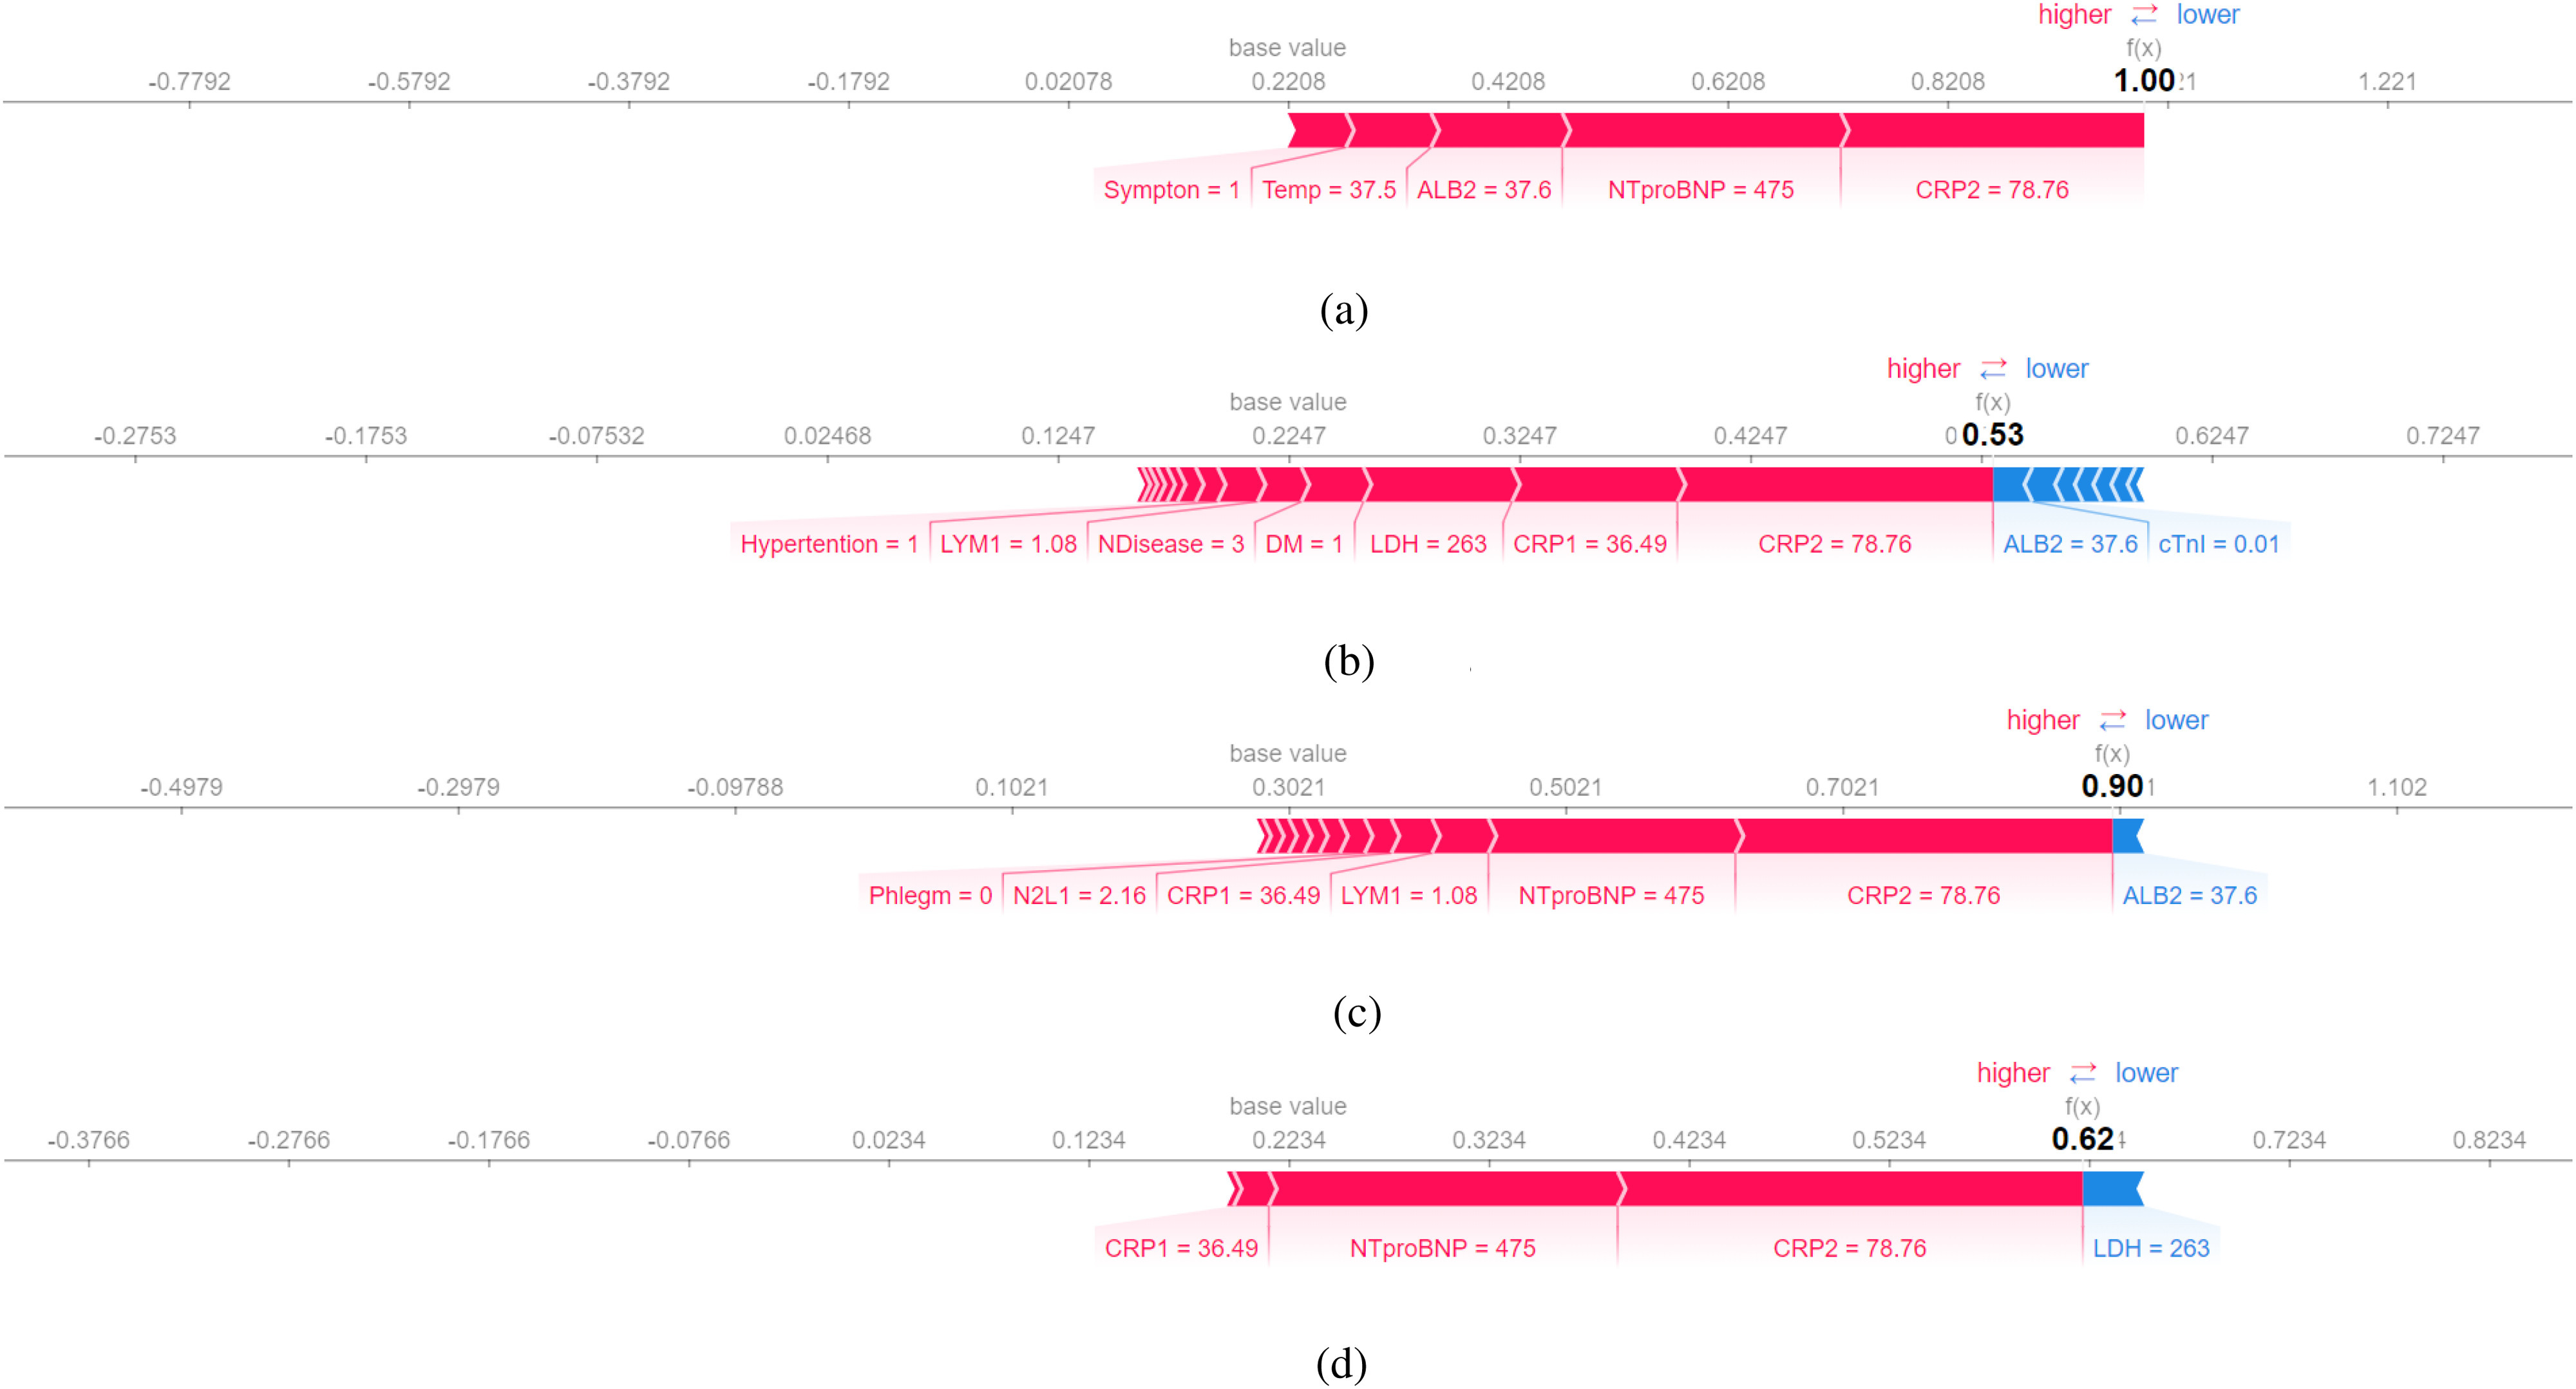
Fig. 8.

SHAP explanation (false-positive patient No.2): Features pushing the prediction to be higher (severe) are shown in red, and those pushing the prediction to be lower (normal) are in blue. (a) Decision Tree. (b) Random Forest. (c) Gradient Boosted Trees. (d) Neural Networks.
