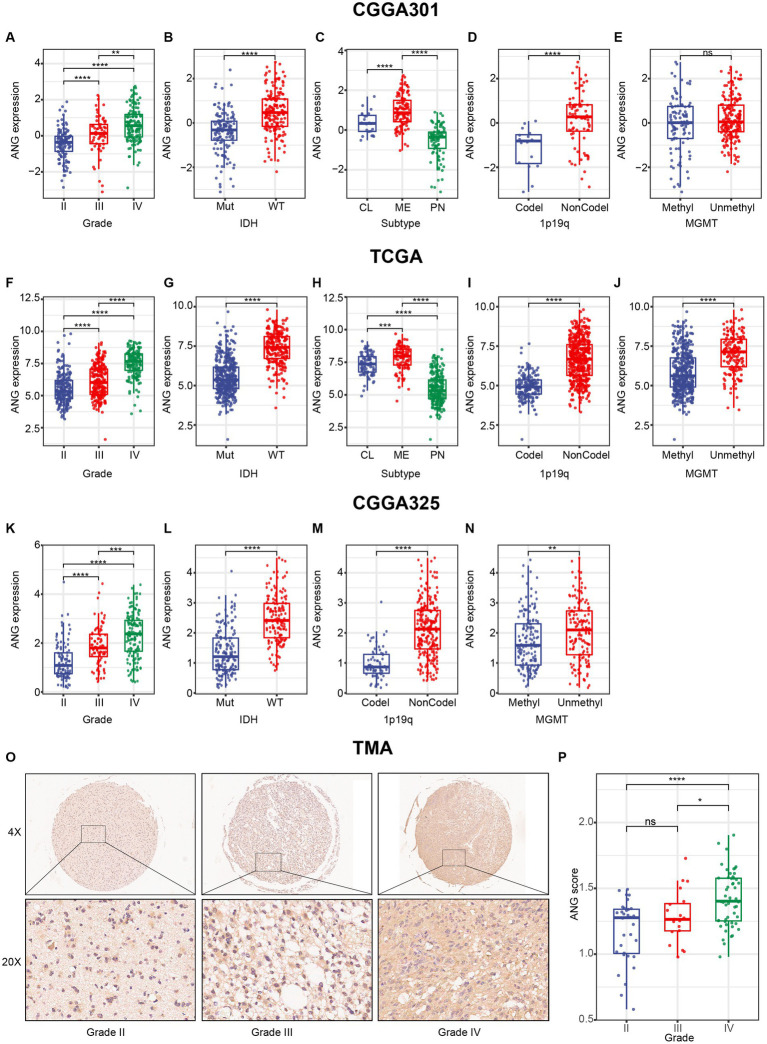
Figure 2.
Distribution of ANG expression stratified by pathological characteristics. (A–E) Distribution of ANG expression stratified by WHO grade (A), IDH mutation status (B), molecular subtype (C), 1p19q codeletion status (D), and MGMT promoter methylation status (E) in CGGA301 dataset. (F–J) Distribution of ANG expression stratified by WHO grade (F), IDH mutation status (G), molecular subtype (H), 1p19q codeletion status (I), and MGMT promoter methylation status (J) in TCGA dataset. (K–N) Distribution of ANG expression stratified by WHO grade (K), IDH mutation status (L), 1p19q codeletion status (M), and MGMT promoter methylation status (N) in CGGA325 dataset. (O) Representative images of IHC staining for ANG across different WHO grades. (P) Comparison of IHC staining intensity (H-score) in different WHO grades of gliomas. Mut, mutation; WT, wildtype; CL, classical; ME, mesenchymal; PN, proneural; Codel, codeletion; NonCodel, non-codeletion; Methyl, methylated; Unmethyl, unmethylated. * indicates p value <0.05, **indicates p value <0.01, *** indicates p value <0.001, **** indicates p value <0.0001. ns, not significant.

