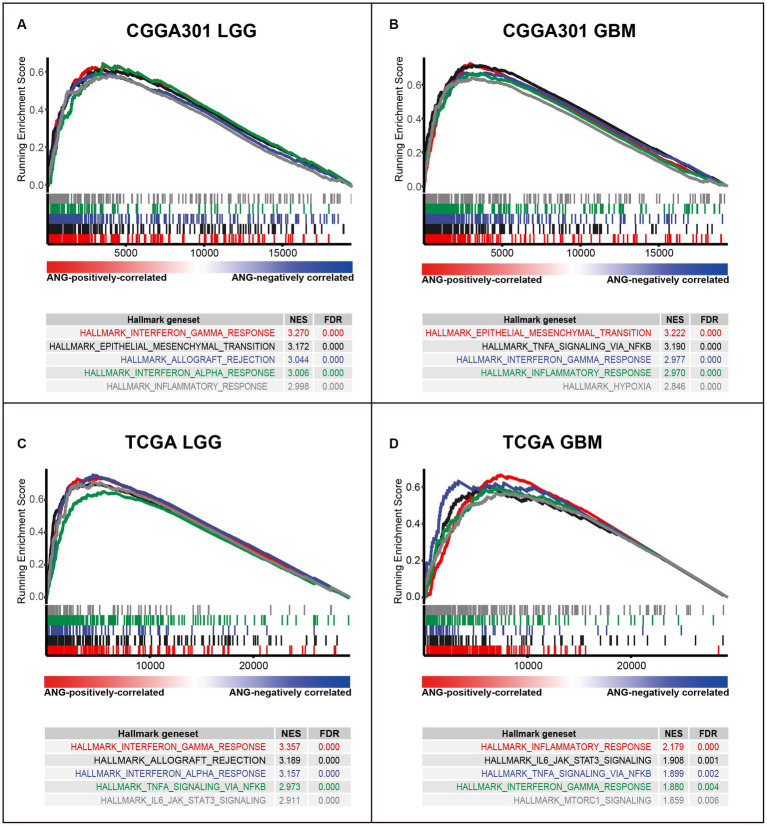
Figure 5.
Gene set enrichment analysis (GSEA) of ANG in CGGA301 and TCGA datasets. (A) GSEA in CGGA301 lower-grade glioma. (B) GSEA in CGGA301 glioblastoma. (C) GSEA in TCGA lower-grade glioma. (D) GSEA in TCGA glioblastoma. LGG, lower grade glioma; GBM, glioblastoma; NES, normalized enrichment score; FDR, false discovery rate.

