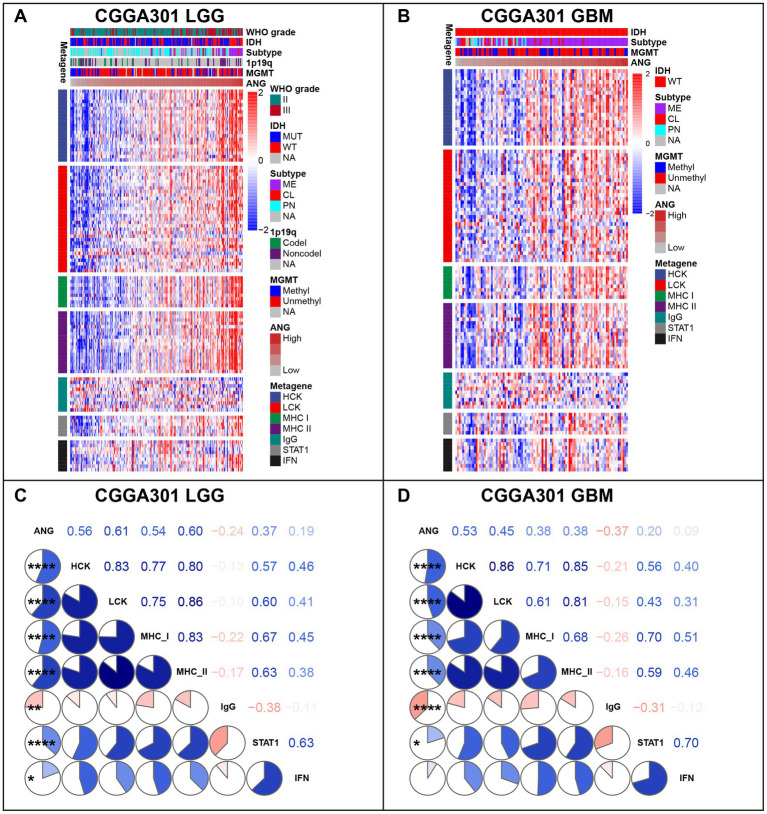
Figure 7.
Gene Sets Variation Analysis (GSVA) of ANG-related inflammatory activities in CGGA301 dataset. (A) Gene heatmap of different inflammatory activities arranged by ANG expression in CGGA301 lower-grade glioma. (B) Gene heatmap of different inflammatory activities arranged by ANG expression in CGGA301 glioblastoma. (C) Intercorrelation between ANG and seven metagenes in CGGA301 lower-grade glioma. (D) Intercorrelation between ANG and seven metagenes in CGGA301 glioblastoma. LGG, lower grade glioma; GBM, glioblastoma; MUT, mutation; WT, wildtype; CL, classical; ME, mesenchymal; PN, proneural; Codel, codeletion; Noncodel, non-codeletion; Methyl, methylated; Unmethyl, unmethylated; NA, not available; HCK, hemopoietic cell kinase, representing immune activities of the monocyte–macrophage lineage; LCK, lymphocyte-specific kinase, representing T-cell immunity; MHC I, major histocompatibility complex I, representing presentation of intracellular antigens; MHC II, major histocompatibility complex II, representing activities of antigen-presenting cells; IgG, representing B-cell immunity; STAT1, signal transducer and activator of transcription 1, representing interferon signal transduction; IFN, interferon, representing interferon-induction and interferon-response. * indicates p value <0.05, **indicates p value <0.01, **** indicates p value <0.0001.

