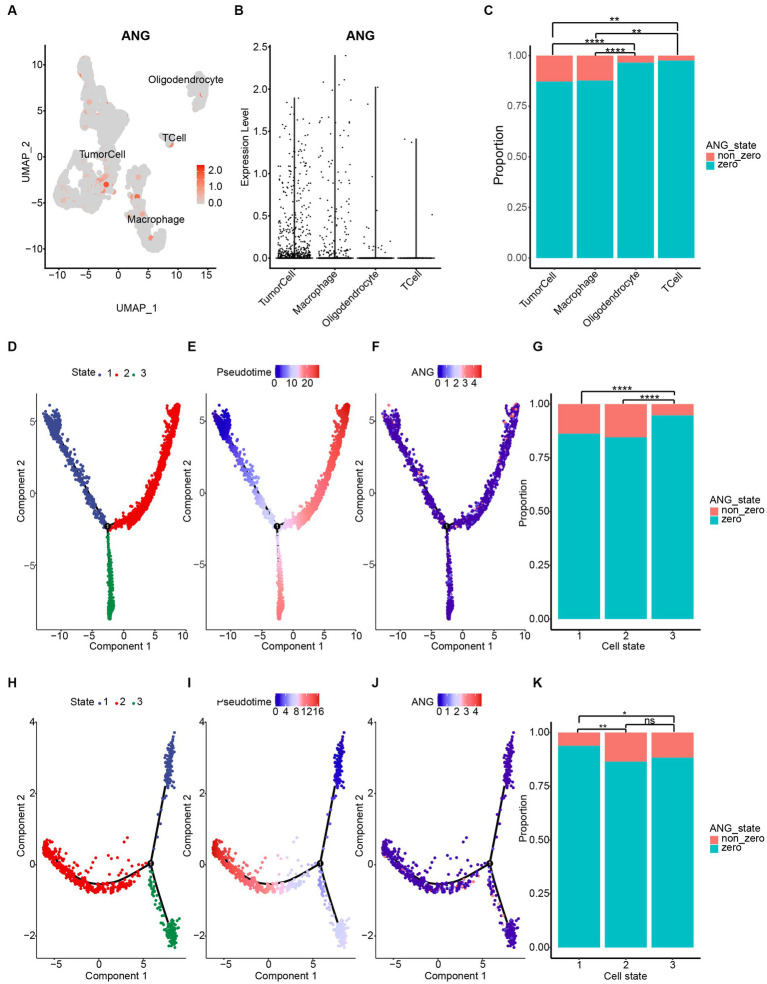
Figure 9.
ANG expression on different cell types based on CGGA single-cell RNAseq data. (A) Four cell clusters were annotated via cell markers in CGGA scRNAseq data. Dimplot displays ANG distribution across different cell types. (B) Vlnplot reveals ANG distribution across different cell types. (C) Statistical results of ANG expression status (zero value vs. non-zero value) across different cell types. ANG is mainly expressed by tumor cells and macrophages in glioma. (D–G) Single-cell pseudotime developmental trajectory analysis of tumor cells reveals three states. Cells are colored based on states (D), pseudotime (E), and ANG expression (F). State 1 could be identified as early developmental-stage tumor cells, while states 2 and 3 could be defined as mature glioma cells. ANG is more upregulated in early-stage tumor cells and is highly and selectively expressed in a particular branch of mature glioma cells (G). (H–K) Single-cell pseudotime developmental trajectory analysis of macrophages reveals three states. Cells are colored based on states (H), pseudotime (I), and ANG expression (J). State 1 could be identified as immature or M0 macrophages, while states 2 and 3 could be defined as polarized macrophages. ANG is significantly upregulated in polarized macrophages rather than immature macrophages (K). * indicates p value <0.05, **indicates p value <0.01, *** indicates p value <0.001, **** indicates p value <0.0001. ns, not significant.

