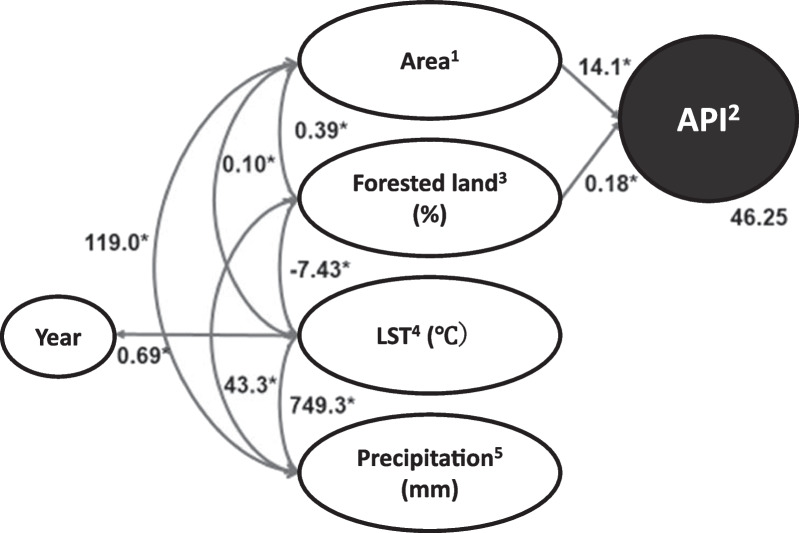
Fig. 5.
Determinants of malaria incidence. Final model of the SEM constructed using data from each province for 2002 to 2015. CMIN/df = 1.252, CFI = 0.989, GFI = 0.989. 1Southern region = 2, and the other regions except capital city = 1, 2API. 3Proportion of forested land was calculated based on European Space Agency (ESA) data. 4LST was based on National Aeronautics and Space Administration (NASA) data. 5Precipitation was also based on NASA data. *All correlations were statistically significant (p < 0.01)

