Fig. 1.
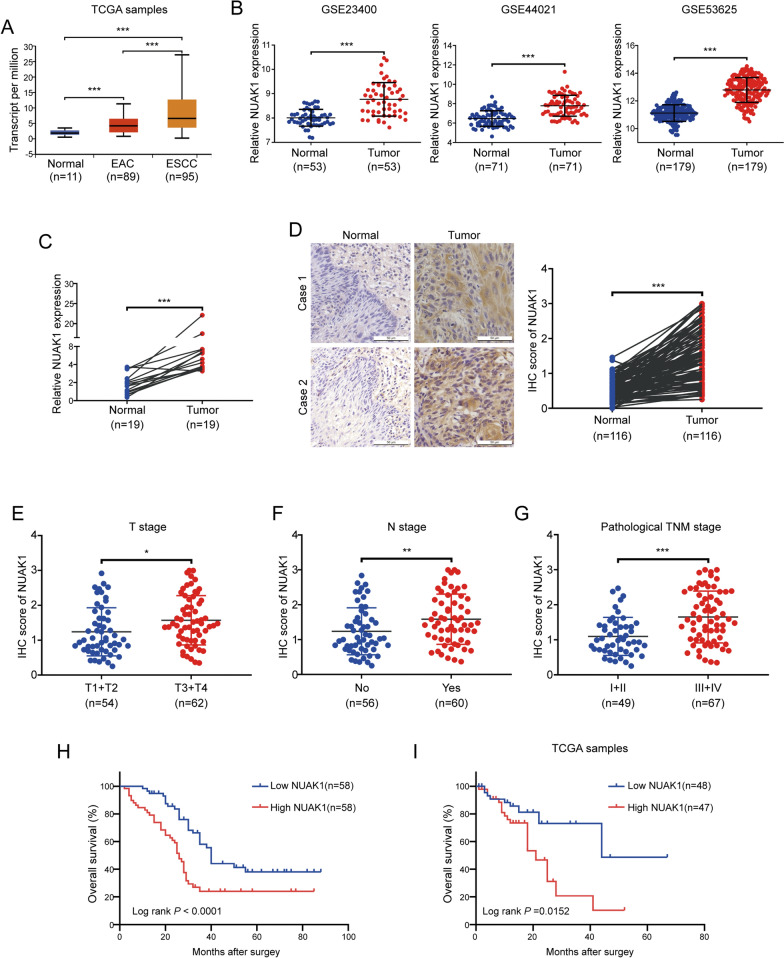
NUAK1 is highly expressed in ESCC. A The mRNA level of NUAK1 was analyzed in normal and cancerous tissues from the TCGA cohort. B Data from the GEO database showed that NUAK1 was upregulated in ESCC tissues compared to the adjacent normal counterparts. C qRT-PCR analysis of the levels of NUAK1 mRNA in 19 pairs of ESCC tumor and matched normal tissues. D IHC staining for NUAK1 was performed in 116 pairs of ESCC tissues and adjacent normal tissues. Representative images (left panel) and IHC scores (right panel) are shown (scale bar, 100 μm). P value was calculated by paired t-test (for A–D). E–G The NUAK1 staining score for T stage (E), N stage (E) and pathological TNM stage (E) in ESCC. P value was calculated by Student’s t-test (for E–G). H Kaplan–Meier analysis revealed that high NUAK1 expression predicted poor prognosis in ESCC. I Survival analysis of TCGA patients from whom the ESCC samples were obtained based on the NUAK1 expression level. P value was calculated by the log-rank test (for H and I). Error bars denote mean ± SD. *P < 0.05; **P < 0.01; ***P < 0.001

