
FIGURE 1.
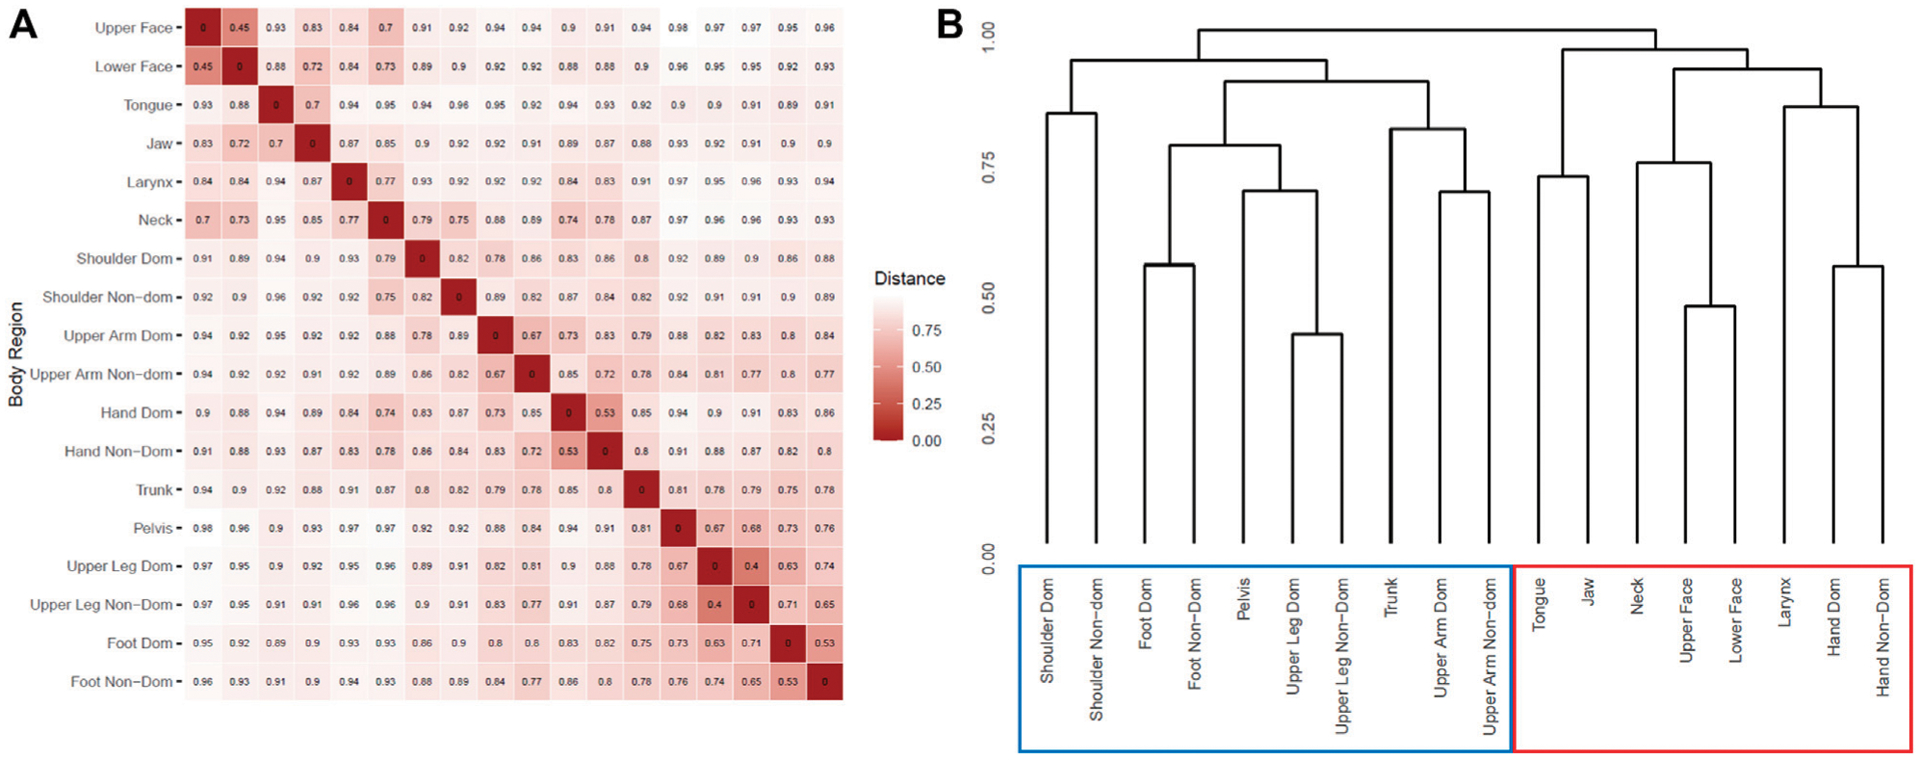
Hierarchical clustering by body region. (A) Asymmetric binary distance matrix for presence of dystonia in each reported body region. Smaller values represent shorter distances and thus more closely associated body regions. (B) Dendrogram result from agglomerative hierarchical clustering of body regions. Scale is in height which is generated from the distance matrix in A. “Dom”: dominant. “Non-Dom”: non-dominant. Red box highlights craniocervical + hand hierarchical group, while blue box highlights non-craniocervical hierarchical group.