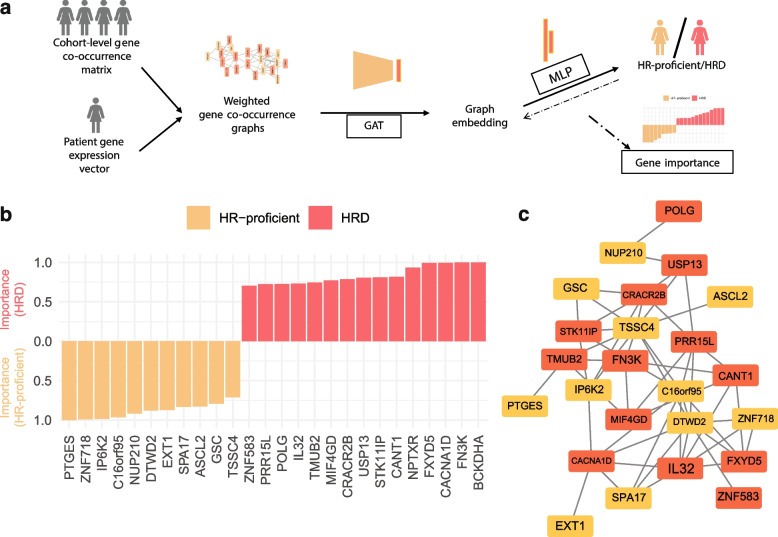
Fig. 4.
Graph analysis to determine transcriptional signature drivers. a Workflow for graph attention network analysis to classify HRD/HR-proficient TCGA-BRCA patients and determine gene importance. Weighted gene co-expression graphs are built from the gene expression profiles of the TCGA-BRCA cohort, whilst taking into account the patient-level gene expression for the 228 genes in the transcriptional HRD signature. A graph attention network (GAT) is then trained to distinguish HRD and HR-proficient samples using the weighted co-expression graphs as inputs. The output highlights part of the graphs with greater weight in the classification and generates an importance score for each gene. b The top-ranked 26 genes in the HRD versus HR-proficiency classification with importance scores greater than 0.7. The colour indicates the phenotype (HRD/HR-proficient) for which the gene is predictive. c The co-expression graph of 24 of the 26 highly ranked genes for classification. Genes are connected only if they are co-expressed in the cohort, and genes with no connections have been removed. The colour of the nodes depicts the associated phenotype as in b

