Fig. 1.
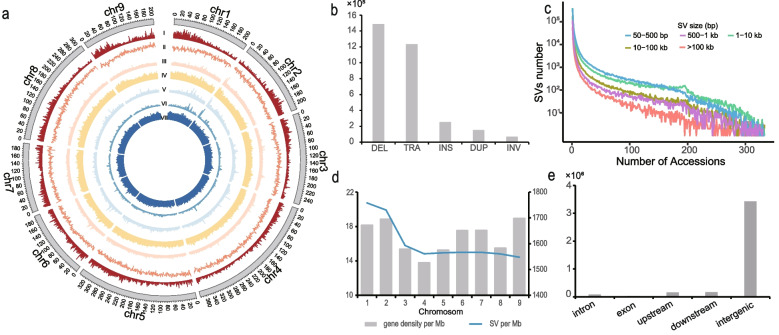
SVs in 133 L. sativa and 200 L. serriola accessions. a The distribution of SVs along the lettuce genome. Circos plot from outer to inter tracks shows, (I) gene density in a 1-Mb sliding window, (II) GC content, (III-VII) SV count in the 1-Mb window for various SV types, including DEL (III), INS (IV), TRA (V), INV (VI), and DUP (VII). b The number of different SV types. c Detection frequencies of SVs with different sizes. d The density of SVs and gene on each chromosome (count per Mb). e The number of SVs from different generic regions

