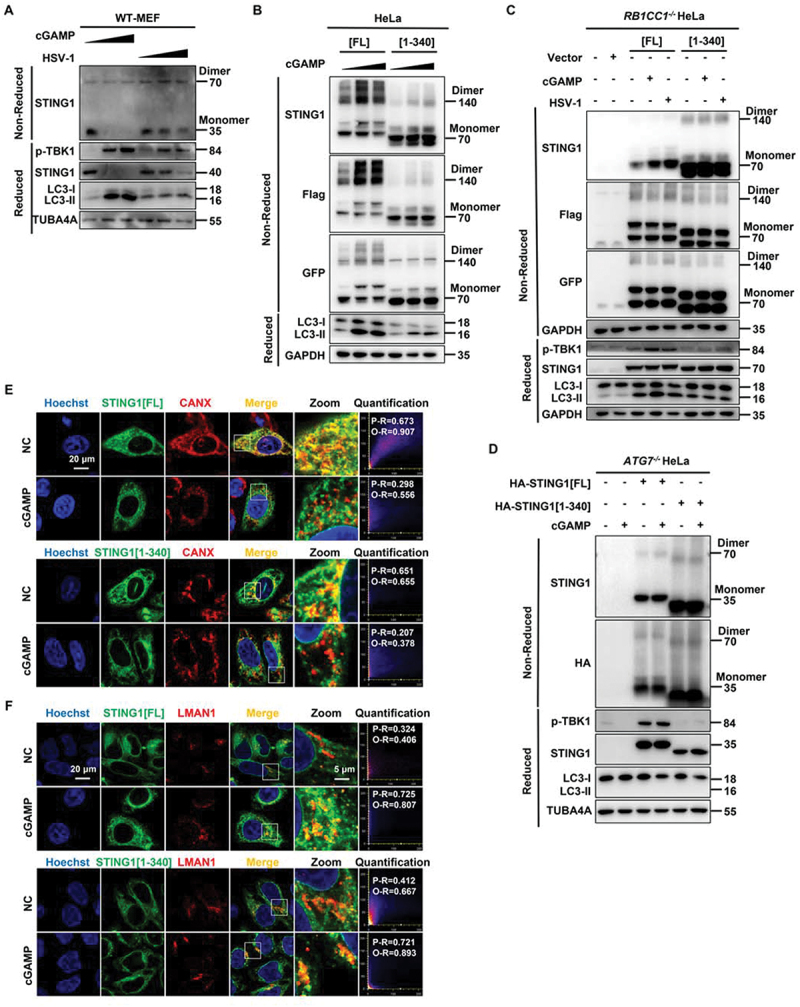
Figure 6.

Translocation and dimerization of STING1 is unchanged in STING1 [1-340] which merely affected innate immune function. (A) WT MEF cells were treated with increasing amounts of cGAMP (0 µM, 1 µM, and 2 µM respectively) for 3 h or infected with increasing MOI of HSV-1-GFP virus (0, 2 and 5 respectively) for 6 h. Cell lysates were analyzed by non-reduced gel (for endogenous STING1 dimerization) or reduced gel followed by immunoblotting with the indicated antibodies. (B) WT HeLa cells stably expressing Flag- and GFP-tagged STING1 or the C-terminal truncation (STING1 [1-340]) were treated with increasing amounts of cGAMP (0 µM, 1 µM and 2 µM respectively) for 3 h. Cell lysates were analyzed by non-reduced gel (for recombinant Flag-STING1-GFP dimerization) or reduced gel followed by immunoblotting with the indicated antibodies. (C) RB1CC1-/- HeLa cells which lacking endogenous STING1 expressing were transfected with control plasmid (pcDNA3.1) or STING1 plasmids (STING1[FL] or STING1 [1-340]) for 24 h before treated with cGAMP (1 μM) for 3 h or infected with HSV-1-GFP virus at a MOI of 5 for 6 h. Cell lysates were analyzed by non-reduced gel (for recombinant Flag-STING1-GFP dimerization) or reduced gel followed by immunoblotting with the indicated antibodies. (D) ATG7-/- HeLa cells which autophagy dysfunction and lacking endogenous STING1 expressing were transfected with HA-tagged STING1 or the C-terminal truncation (STING1 [1-340]) for 24 h, cells were then treated with cGAMP (1 μM) for 3 h. Cell lysates were analyzed by non-reduced gel (for recombinant HA-STING1 dimerization) or reduced gel followed by immunoblotting with the indicated antibodies. (E-F) HeLa cells stably expressing GFP-tagged STING1 or the C-terminal truncation (STING1 [1-340]) were fixed and stained with marker antibody for ER (CANX) and the ER-Golgi intermediate compartment (LMAN1/ERGIC-53) after treated with or without 1 μM of cGAMP for 3 h, and images were then captured by confocal microscopy. All images are representative of at least three independent experiments in which > 95% of the cells displayed similar staining. Scale bar: 20 µm. The degree of colocalization for STING1 and CANX or LMAN1 was quantified by Pearson’s and overlap coefficient by Image J.
