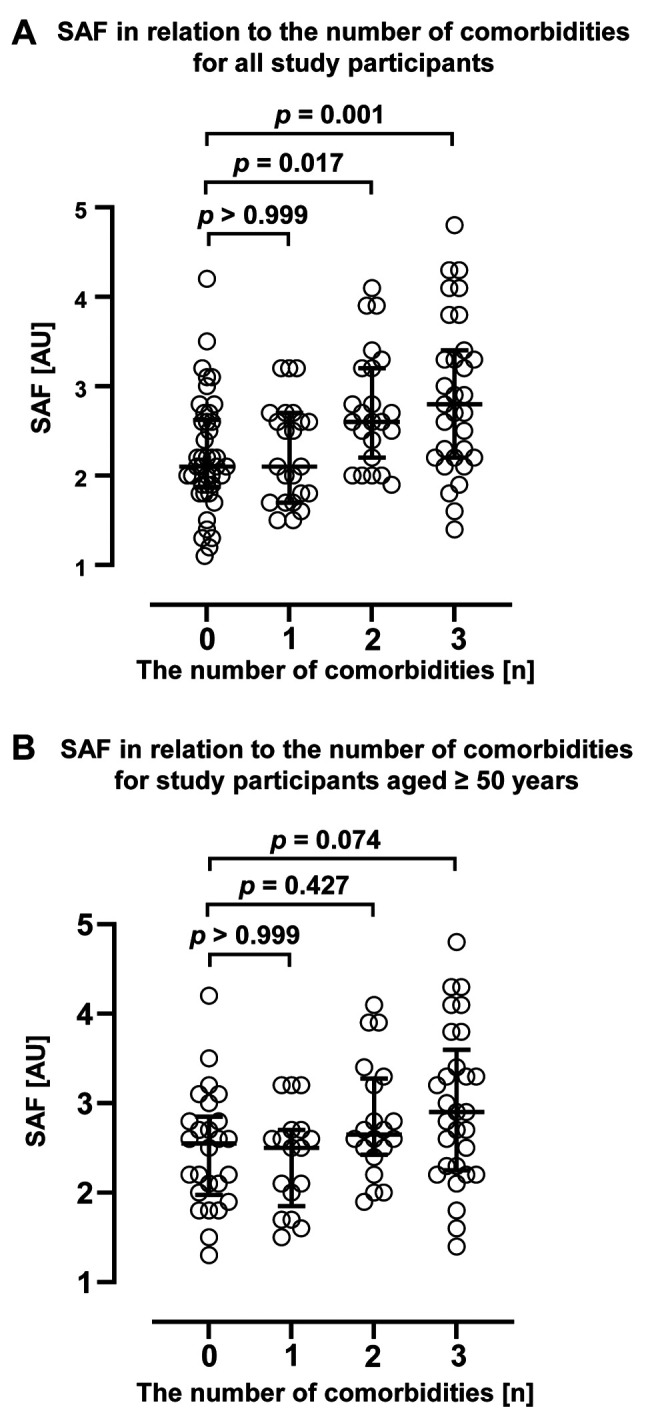
Figure 3. Variation in skin autofluorescence (SAF) with changes in the number of comorbidities. The figure shows the SAF variations according to the number of comorbidities in all patients (A) and in patients aged ≥50 years (B). Comparisons for study participants without comorbidities were performed using the Kruskal-Wallis test followed by Dunn’s multiple comparisons test. The bars represent the median and interquartile range. AU: Arbitrary unit; p-value is shown in each figure.

